|
Download Data (XLS File) |
|
||||||||
|
||||||||
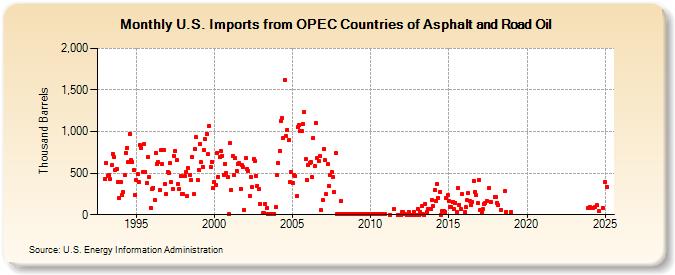
| U.S. Imports from OPEC Countries of Asphalt and Road Oil (Thousand Barrels) | ||||||||
| Year | Jan | Feb | Mar | Apr | May | Jun | Jul | Aug | Sep | Oct | Nov | Dec |
|---|---|---|---|---|---|---|---|---|---|---|---|---|
| 1993 | 430 | 623 | 469 | 483 | 424 | 592 | 735 | 693 | 541 | 548 | 388 | 201 |
| 1994 | 393 | 243 | 271 | 477 | 746 | 803 | 630 | 976 | 655 | 632 | 543 | 240 |
| 1995 | 416 | 488 | 388 | 834 | 802 | 513 | 852 | 518 | 381 | 688 | 455 | 86 |
| 1996 | 308 | 327 | 179 | 748 | 614 | 628 | 300 | 775 | 606 | 779 | 373 | 249 |
| 1997 | 513 | 498 | 621 | 389 | 311 | 712 | 767 | 654 | 371 | 315 | 463 | 255 |
| 1998 | 245 | 461 | 510 | 228 | 559 | 482 | 412 | 694 | 244 | 787 | 930 | 416 |
| 1999 | 540 | 850 | 630 | 578 | 778 | 905 | 970 | 730 | 1,068 | 573 | 637 | 320 |
| 2000 | 394 | 359 | 743 | 457 | 688 | 771 | 712 | 482 | 610 | 497 | 448 | 3 |
| 2001 | 862 | 300 | 706 | 479 | 677 | 531 | 605 | 627 | 314 | 595 | 574 | 56 |
| 2002 | 680 | 547 | 528 | 229 | 456 | 328 | 672 | 650 | 470 | 350 | 304 | 130 |
| 2003 | 15 | 15 | 133 | 75 | 11 | 10 | 11 | 8 | 10 | 9 | 87 | |
| 2004 | 477 | 623 | 766 | 1,127 | 1,162 | 928 | 1,625 | 948 | 1,023 | 895 | 393 | 517 |
| 2005 | 385 | 472 | 462 | 222 | 1,053 | 1,079 | 1,003 | 1,002 | 1,089 | 1,237 | 666 | 421 |
| 2006 | 599 | 625 | 636 | 450 | 921 | 591 | 1,105 | 682 | 640 | 703 | 51 | 173 |
| 2007 | 793 | 657 | 244 | 604 | 349 | 475 | 515 | 456 | 278 | 739 | 8 | 6 |
| 2008 | 8 | 166 | 5 | 9 | 6 | 6 | 6 | 6 | 9 | 7 | 7 | 7 |
| 2009 | 7 | 8 | 6 | 9 | 7 | 5 | 7 | 5 | 6 | 7 | 6 | 7 |
| 2010 | 5 | 8 | 7 | 5 | 6 | 7 | 5 | 7 | 5 | 6 | 5 | 6 |
| 2011 | 1 | 69 | 1 | 1 | 2 | |||||||
| 2012 | 34 | 35 | 3 | 2 | 33 | 1 | 1 | 1 | 34 | 1 | 1 | |
| 2013 | 68 | 1 | 33 | 101 | 3 | 1 | 133 | 34 | 66 | 72 | 171 | |
| 2014 | 108 | 303 | 165 | 372 | 205 | 279 | 1 | 50 | 48 | 33 | 199 | 232 |
| 2015 | 160 | 87 | 89 | 157 | 65 | 145 | 37 | 316 | 117 | 69 | 248 | |
| 2016 | 33 | 87 | 173 | 263 | 167 | 112 | 154 | 408 | 279 | 232 | 137 | 419 |
| 2017 | 56 | 32 | 66 | 128 | 139 | 170 | 319 | 157 | 219 | |||
| 2018 | 218 | 145 | 118 | 55 | 282 | 36 | ||||||
| 2019 | 31 | |||||||||||
| 2023 | 84 | |||||||||||
| 2024 | 92 | 86 | 85 | |||||||||
| - = No Data Reported; -- = Not Applicable; NA = Not Available; W = Withheld to avoid disclosure of individual company data. |
| Release Date: 6/28/2024 |
| Next Release Date: 7/31/2024 |