|
Download Data (XLS File) |
|
||||||||
|
||||||||
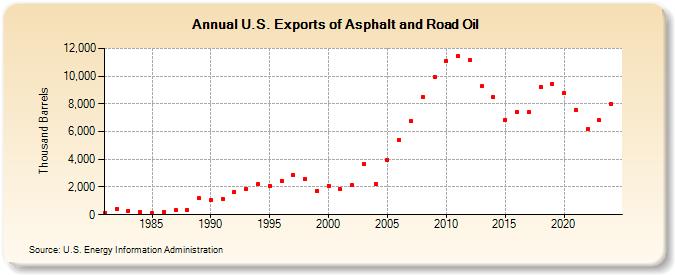
| U.S. Exports of Asphalt and Road Oil (Thousand Barrels) | ||||||||
| Decade | Year-0 | Year-1 | Year-2 | Year-3 | Year-4 | Year-5 | Year-6 | Year-7 | Year-8 | Year-9 |
|---|---|---|---|---|---|---|---|---|---|---|
| 1980's | 146 | 444 | 290 | 185 | 114 | 209 | 328 | 335 | 1,170 | |
| 1990's | 1,055 | 1,161 | 1,658 | 1,860 | 2,181 | 2,101 | 2,448 | 2,879 | 2,586 | 1,735 |
| 2000's | 2,104 | 1,829 | 2,115 | 3,649 | 2,215 | 3,943 | 5,405 | 6,757 | 8,504 | 9,950 |
| 2010's | 11,091 | 11,446 | 11,152 | 9,251 | 8,496 | 6,850 | 7,438 | 7,399 | 9,238 | 9,459 |
| 2020's | 8,773 | 7,574 | 6,187 | 6,801 |
| - = No Data Reported; -- = Not Applicable; NA = Not Available; W = Withheld to avoid disclosure of individual company data. |
| Release Date: 3/29/2024 |
| Next Release Date: 8/30/2024 |