|
Download Data (XLS File) |
|
||||||||
|
||||||||
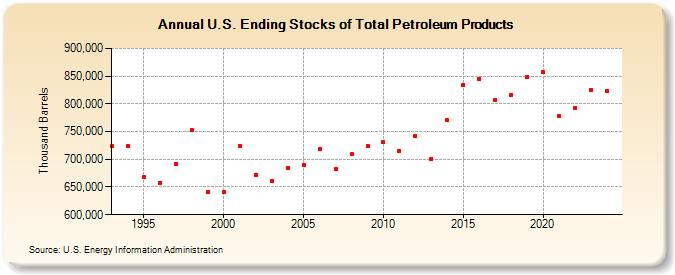
| U.S. Ending Stocks of Total Petroleum Products (Thousand Barrels) | ||||||||
| Decade | Year-0 | Year-1 | Year-2 | Year-3 | Year-4 | Year-5 | Year-6 | Year-7 | Year-8 | Year-9 |
|---|---|---|---|---|---|---|---|---|---|---|
| 1990's | 724,754 | 723,870 | 667,884 | 657,747 | 691,640 | 752,027 | 641,208 | |||
| 2000's | 641,362 | 724,128 | 671,205 | 661,040 | 683,464 | 689,356 | 718,625 | 682,299 | 709,076 | 724,580 |
| 2010's | 730,976 | 715,406 | 741,839 | 701,200 | 769,952 | 834,704 | 845,182 | 807,524 | 816,437 | 849,108 |
| 2020's | 857,877 | 777,428 | 792,490 | 825,829 |
| - = No Data Reported; -- = Not Applicable; NA = Not Available; W = Withheld to avoid disclosure of individual company data. |
| Release Date: 3/29/2024 |
| Next Release Date: 8/30/2024 |