|
Download Data (XLS File) |
|
||||||||
|
||||||||
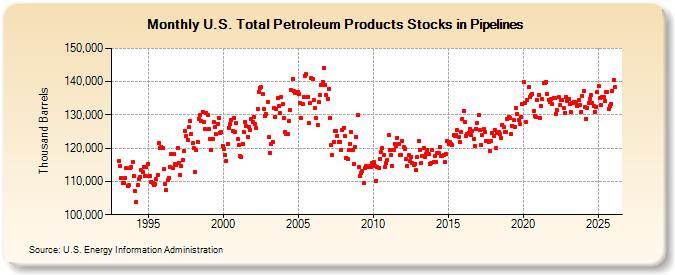
| U.S. Total Petroleum Products Stocks in Pipelines (Thousand Barrels) | ||||||||
| Year | Jan | Feb | Mar | Apr | May | Jun | Jul | Aug | Sep | Oct | Nov | Dec |
|---|---|---|---|---|---|---|---|---|---|---|---|---|
| 1993 | 116,242 | 114,676 | 111,053 | 109,416 | 109,470 | 111,051 | 113,917 | 108,579 | 108,800 | 113,970 | 114,376 | 115,902 |
| 1994 | 111,693 | 106,990 | 103,836 | 108,816 | 110,613 | 111,396 | 113,413 | 112,723 | 114,443 | 111,515 | 114,417 | 115,167 |
| 1995 | 111,491 | 111,738 | 109,911 | 109,536 | 109,047 | 109,170 | 110,771 | 111,924 | 121,617 | 120,098 | 120,457 | 119,947 |
| 1996 | 113,723 | 109,330 | 107,297 | 110,369 | 111,052 | 114,294 | 118,253 | 113,941 | 118,226 | 115,196 | 115,008 | 120,128 |
| 1997 | 115,535 | 111,801 | 114,530 | 116,585 | 119,048 | 125,225 | 123,733 | 122,554 | 126,430 | 128,244 | 124,398 | 121,467 |
| 1998 | 120,085 | 112,951 | 119,380 | 121,988 | 128,740 | 129,968 | 128,225 | 130,969 | 127,825 | 125,648 | 130,706 | 129,987 |
| 1999 | 125,814 | 122,800 | 119,494 | 122,827 | 127,750 | 126,432 | 124,173 | 127,210 | 129,073 | 124,714 | 124,761 | 120,771 |
| 2000 | 119,771 | 117,851 | 116,264 | 121,221 | 126,171 | 127,175 | 128,358 | 125,132 | 129,164 | 125,015 | 127,486 | 122,652 |
| 2001 | 120,981 | 117,612 | 117,482 | 121,385 | 124,930 | 127,769 | 126,577 | 123,502 | 126,440 | 125,563 | 128,796 | 127,978 |
| 2002 | 129,403 | 127,156 | 126,209 | 131,807 | 136,755 | 138,150 | 138,305 | 136,140 | 131,781 | 129,600 | 130,228 | 133,990 |
| 2003 | 123,252 | 118,650 | 121,361 | 121,922 | 131,942 | 129,230 | 131,898 | 135,075 | 132,625 | 130,467 | 135,435 | 133,236 |
| 2004 | 129,052 | 124,966 | 124,268 | 124,192 | 128,160 | 131,420 | 137,508 | 140,911 | 137,105 | 136,456 | 136,752 | 136,770 |
| 2005 | 136,213 | 133,615 | 129,078 | 133,431 | 135,322 | 141,734 | 142,196 | 135,514 | 127,543 | 133,546 | 140,965 | 140,668 |
| 2006 | 134,553 | 132,208 | 128,937 | 126,983 | 133,876 | 136,060 | 139,097 | 140,031 | 143,964 | 138,868 | 135,905 | 134,810 |
| 2007 | 137,920 | 129,096 | 120,874 | 117,967 | 121,995 | 125,167 | 125,222 | 123,770 | 122,009 | 121,891 | 119,525 | 125,403 |
| 2008 | 126,178 | 123,638 | 117,135 | 116,864 | 119,306 | 121,168 | 124,808 | 119,528 | 115,193 | 120,393 | 123,505 | 130,073 |
| 2009 | 114,262 | 111,583 | 112,438 | 113,225 | 109,479 | 113,941 | 114,646 | 114,364 | 114,220 | 114,553 | 114,294 | 115,483 |
| 2010 | 115,767 | 114,687 | 110,255 | 114,198 | 113,952 | 116,796 | 118,788 | 119,917 | 117,888 | 114,457 | 115,505 | 116,509 |
| 2011 | 123,838 | 119,594 | 117,888 | 114,519 | 119,525 | 121,291 | 120,512 | 123,145 | 121,180 | 117,881 | 118,092 | 122,163 |
| 2012 | 120,483 | 119,616 | 116,711 | 114,508 | 118,019 | 116,070 | 117,426 | 115,512 | 114,935 | 115,372 | 113,394 | 117,366 |
| 2013 | 122,213 | 119,440 | 115,534 | 117,656 | 119,996 | 117,251 | 118,285 | 119,552 | 118,281 | 115,262 | 115,473 | 119,376 |
| 2014 | 115,977 | 117,621 | 115,790 | 118,404 | 118,636 | 120,227 | 117,598 | 117,530 | 118,057 | 115,796 | 118,156 | 122,305 |
| 2015 | 121,215 | 121,945 | 121,274 | 120,869 | 123,907 | 123,772 | 124,047 | 125,401 | 123,341 | 121,823 | 125,006 | 128,830 |
| 2016 | 131,109 | 127,885 | 123,802 | 124,338 | 124,600 | 125,885 | 123,886 | 125,204 | 122,864 | 120,707 | 125,833 | 127,693 |
| 2017 | 129,975 | 125,386 | 121,067 | 123,940 | 125,771 | 125,014 | 122,258 | 122,160 | 121,845 | 119,158 | 122,176 | 124,428 |
| 2018 | 123,520 | 125,606 | 119,943 | 124,627 | 124,734 | 124,279 | 123,072 | 127,108 | 126,251 | 124,944 | 124,926 | 128,694 |
| 2019 | 129,378 | 129,132 | 124,210 | 126,708 | 128,571 | 126,387 | 132,080 | 130,384 | 128,359 | 127,356 | 129,421 | 133,275 |
| 2020 | 139,814 | 133,720 | 128,012 | 134,530 | 138,322 | 135,516 | 136,013 | 136,228 | 131,043 | 129,623 | 129,258 | 134,484 |
| 2021 | 136,005 | 129,130 | 132,713 | 134,667 | 139,717 | 139,623 | 139,939 | 136,266 | 134,563 | 133,843 | 134,646 | 133,432 |
| 2022 | 135,084 | 135,050 | 130,388 | 131,470 | 135,376 | 132,918 | 134,623 | 134,447 | 132,206 | 130,662 | 135,514 | 134,312 |
| 2023 | 134,881 | 133,197 | 130,877 | 133,699 | 133,935 | 133,840 | 133,665 | 132,573 | 134,433 | 133,039 | 130,982 | 135,687 |
| 2024 | 138,117 | 132,299 | 128,942 | 132,138 | 130,015 | 135,533 | ||||||
| - = No Data Reported; -- = Not Applicable; NA = Not Available; W = Withheld to avoid disclosure of individual company data. |
| Release Date: 8/30/2024 |
| Next Release Date: 9/30/2024 |