|
Download Data (XLS File) |
|
||||||||
|
||||||||
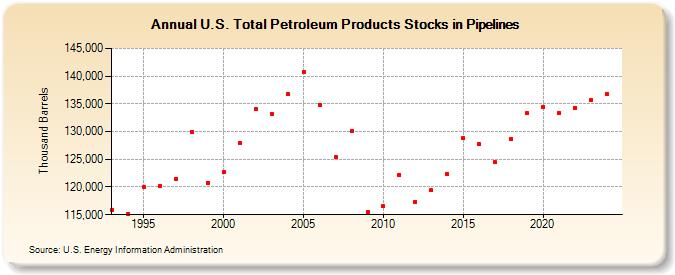
| U.S. Total Petroleum Products Stocks in Pipelines (Thousand Barrels) | ||||||||
| Decade | Year-0 | Year-1 | Year-2 | Year-3 | Year-4 | Year-5 | Year-6 | Year-7 | Year-8 | Year-9 |
|---|---|---|---|---|---|---|---|---|---|---|
| 1990's | 115,902 | 115,167 | 119,947 | 120,128 | 121,467 | 129,987 | 120,771 | |||
| 2000's | 122,652 | 127,978 | 133,990 | 133,236 | 136,770 | 140,668 | 134,810 | 125,403 | 130,073 | 115,483 |
| 2010's | 116,509 | 122,163 | 117,366 | 119,376 | 122,305 | 128,830 | 127,693 | 124,428 | 128,694 | 133,275 |
| 2020's | 134,484 | 133,432 | 134,312 | 136,201 |
| - = No Data Reported; -- = Not Applicable; NA = Not Available; W = Withheld to avoid disclosure of individual company data. |
| Release Date: 3/29/2024 |
| Next Release Date: 8/30/2024 |