|
Download Data (XLS File) |
|
||||||||
|
||||||||
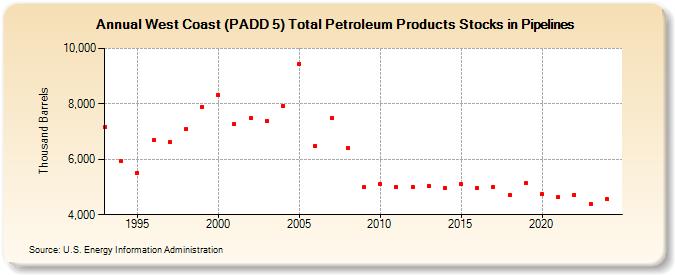
| West Coast (PADD 5) Total Petroleum Products Stocks in Pipelines (Thousand Barrels) | ||||||||
| Decade | Year-0 | Year-1 | Year-2 | Year-3 | Year-4 | Year-5 | Year-6 | Year-7 | Year-8 | Year-9 |
|---|---|---|---|---|---|---|---|---|---|---|
| 1990's | 7,154 | 5,929 | 5,518 | 6,688 | 6,622 | 7,083 | 7,898 | |||
| 2000's | 8,310 | 7,270 | 7,473 | 7,385 | 7,939 | 9,452 | 6,492 | 7,494 | 6,424 | 4,985 |
| 2010's | 5,102 | 5,005 | 5,017 | 5,051 | 4,955 | 5,098 | 4,968 | 5,011 | 4,715 | 5,132 |
| 2020's | 4,746 | 4,629 | 4,723 | 4,380 |
| - = No Data Reported; -- = Not Applicable; NA = Not Available; W = Withheld to avoid disclosure of individual company data. |
| Release Date: 3/29/2024 |
| Next Release Date: 8/30/2024 |