|
Download Data (XLS File) |
|
||||||||
|
||||||||
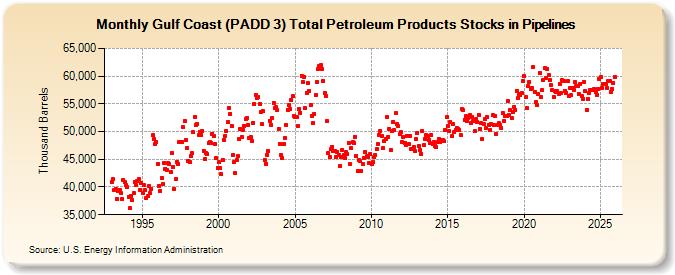
| Gulf Coast (PADD 3) Total Petroleum Products Stocks in Pipelines (Thousand Barrels) | ||||||||
| Year | Jan | Feb | Mar | Apr | May | Jun | Jul | Aug | Sep | Oct | Nov | Dec |
|---|---|---|---|---|---|---|---|---|---|---|---|---|
| 1993 | 40,970 | 41,360 | 39,462 | 39,648 | 37,842 | 39,336 | 39,545 | 38,867 | 37,910 | 41,288 | 40,910 | 40,345 |
| 1994 | 39,993 | 38,268 | 36,161 | 38,404 | 37,588 | 38,845 | 40,871 | 40,287 | 41,037 | 41,352 | 39,522 | 40,705 |
| 1995 | 38,860 | 40,328 | 39,394 | 37,987 | 38,306 | 40,092 | 38,827 | 39,709 | 49,288 | 48,632 | 47,714 | 48,109 |
| 1996 | 44,205 | 40,269 | 39,304 | 41,628 | 40,509 | 44,336 | 43,297 | 43,058 | 44,350 | 44,224 | 42,708 | 46,169 |
| 1997 | 43,609 | 39,668 | 41,386 | 44,559 | 44,207 | 48,060 | 48,132 | 48,173 | 50,745 | 51,917 | 48,466 | 46,989 |
| 1998 | 44,670 | 44,471 | 45,571 | 46,050 | 49,855 | 52,648 | 51,113 | 51,365 | 49,388 | 49,937 | 49,450 | 50,126 |
| 1999 | 46,570 | 45,035 | 46,191 | 45,944 | 47,914 | 48,068 | 47,958 | 49,613 | 49,189 | 47,748 | 45,214 | 43,463 |
| 2000 | 44,453 | 43,339 | 42,294 | 44,928 | 48,496 | 49,267 | 50,050 | 51,674 | 54,255 | 53,232 | 51,063 | 45,838 |
| 2001 | 44,580 | 42,475 | 44,952 | 45,568 | 48,599 | 50,515 | 49,034 | 50,362 | 51,071 | 52,220 | 52,502 | 51,202 |
| 2002 | 48,827 | 48,932 | 48,362 | 51,599 | 54,947 | 56,595 | 56,140 | 56,190 | 54,979 | 53,571 | 51,336 | 53,652 |
| 2003 | 44,896 | 44,237 | 45,824 | 46,478 | 51,956 | 51,271 | 52,476 | 55,152 | 54,239 | 54,352 | 53,819 | 50,513 |
| 2004 | 47,801 | 45,739 | 45,207 | 47,770 | 48,859 | 51,255 | 53,933 | 54,799 | 54,155 | 55,715 | 56,323 | 52,845 |
| 2005 | 52,642 | 52,579 | 51,019 | 54,083 | 53,415 | 60,101 | 58,934 | 59,898 | 54,174 | 57,041 | 58,704 | 57,306 |
| 2006 | 54,739 | 52,811 | 51,486 | 53,193 | 56,605 | 58,912 | 61,321 | 61,739 | 61,969 | 61,218 | 59,131 | 56,865 |
| 2007 | 56,473 | 51,894 | 46,062 | 45,449 | 46,767 | 47,295 | 46,529 | 46,489 | 45,495 | 46,300 | 45,689 | 43,849 |
| 2008 | 45,430 | 46,731 | 45,720 | 45,312 | 46,243 | 45,963 | 48,015 | 44,088 | 46,948 | 48,088 | 47,941 | 49,034 |
| 2009 | 45,646 | 42,828 | 44,927 | 44,638 | 42,940 | 44,115 | 45,272 | 46,399 | 45,533 | 45,323 | 44,369 | 45,994 |
| 2010 | 44,207 | 44,472 | 45,474 | 45,768 | 46,791 | 47,779 | 49,455 | 50,124 | 49,188 | 46,973 | 48,332 | 48,675 |
| 2011 | 52,582 | 49,091 | 50,466 | 46,744 | 50,098 | 51,735 | 50,244 | 53,374 | 51,360 | 50,941 | 49,552 | 49,878 |
| 2012 | 48,174 | 48,981 | 48,011 | 47,637 | 49,283 | 47,821 | 49,163 | 46,803 | 46,848 | 47,180 | 46,442 | 48,624 |
| 2013 | 49,739 | 47,432 | 46,652 | 46,039 | 50,086 | 47,557 | 48,603 | 49,345 | 49,114 | 48,471 | 47,928 | 49,429 |
| 2014 | 47,689 | 48,085 | 47,405 | 47,176 | 48,138 | 48,647 | 48,186 | 48,442 | 48,468 | 48,287 | 50,269 | 52,581 |
| 2015 | 51,079 | 50,097 | 51,733 | 49,143 | 51,298 | 49,943 | 50,292 | 50,684 | 50,525 | 50,295 | 49,443 | 54,137 |
| 2016 | 53,825 | 52,172 | 52,743 | 51,919 | 52,512 | 52,911 | 51,454 | 52,609 | 51,887 | 50,112 | 52,233 | 51,759 |
| 2017 | 52,983 | 50,479 | 51,529 | 48,627 | 51,283 | 52,213 | 50,598 | 52,555 | 51,265 | 50,351 | 51,315 | 52,935 |
| 2018 | 51,148 | 52,808 | 49,595 | 51,232 | 51,477 | 51,095 | 50,629 | 53,371 | 51,951 | 52,863 | 52,870 | 55,515 |
| 2019 | 52,959 | 53,923 | 52,368 | 53,558 | 54,501 | 53,904 | 57,378 | 55,992 | 56,703 | 56,578 | 56,926 | 59,086 |
| 2020 | 59,945 | 56,245 | 54,210 | 58,161 | 58,948 | 57,673 | 57,939 | 61,663 | 57,209 | 55,261 | 54,730 | 56,733 |
| 2021 | 60,580 | 56,321 | 57,432 | 59,301 | 61,415 | 59,588 | 61,290 | 60,144 | 59,322 | 58,317 | 57,491 | 56,244 |
| 2022 | 57,353 | 57,112 | 57,229 | 56,844 | 58,647 | 56,946 | 59,209 | 59,203 | 57,400 | 57,006 | 59,040 | 56,497 |
| 2023 | 58,622 | 57,242 | 58,548 | 58,281 | 59,534 | 59,144 | 58,581 | 57,121 | 60,854 | 56,775 | 56,806 | 59,770 |
| 2024 | 57,423 | |||||||||||
| - = No Data Reported; -- = Not Applicable; NA = Not Available; W = Withheld to avoid disclosure of individual company data. |
| Release Date: 3/29/2024 |
| Next Release Date: 4/30/2024 |