|
Download Data (XLS File) |
|
||||||||
|
||||||||
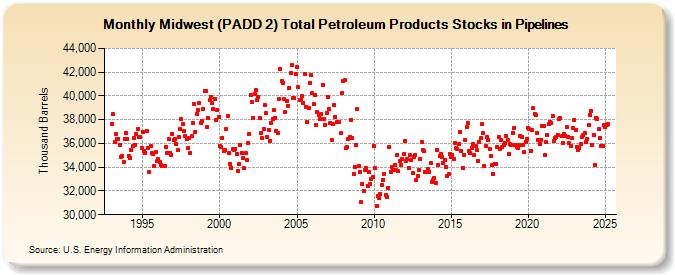
| Midwest (PADD 2) Total Petroleum Products Stocks in Pipelines (Thousand Barrels) | ||||||||
| Year | Jan | Feb | Mar | Apr | May | Jun | Jul | Aug | Sep | Oct | Nov | Dec |
|---|---|---|---|---|---|---|---|---|---|---|---|---|
| 1993 | 37,645 | 38,445 | 36,119 | 36,825 | 36,351 | 36,384 | 35,878 | 34,891 | 34,941 | 34,431 | 36,405 | 36,878 |
| 1994 | 36,396 | 34,908 | 34,802 | 35,443 | 35,779 | 36,473 | 35,908 | 36,768 | 37,239 | 36,572 | 36,557 | 35,597 |
| 1995 | 36,992 | 35,371 | 35,197 | 37,086 | 35,625 | 33,563 | 35,794 | 35,194 | 35,145 | 34,104 | 35,255 | 34,511 |
| 1996 | 34,687 | 34,440 | 34,208 | 34,098 | 34,132 | 34,092 | 35,733 | 35,166 | 36,334 | 35,178 | 35,049 | 36,810 |
| 1997 | 36,249 | 36,344 | 35,973 | 35,434 | 36,531 | 37,234 | 38,016 | 37,644 | 37,065 | 36,633 | 36,411 | 35,575 |
| 1998 | 36,489 | 35,175 | 36,601 | 37,736 | 39,307 | 37,001 | 38,474 | 38,810 | 39,444 | 37,738 | 37,915 | 38,924 |
| 1999 | 40,382 | 40,380 | 37,425 | 38,127 | 39,622 | 39,936 | 39,413 | 38,922 | 39,761 | 37,989 | 38,827 | 38,266 |
| 2000 | 35,763 | 35,688 | 36,483 | 35,363 | 35,415 | 37,244 | 38,287 | 35,214 | 34,263 | 33,924 | 35,499 | 35,478 |
| 2001 | 35,535 | 35,147 | 33,714 | 34,288 | 35,867 | 35,203 | 34,792 | 33,895 | 35,178 | 34,595 | 36,034 | 36,798 |
| 2002 | 40,115 | 39,459 | 38,163 | 40,173 | 40,491 | 39,615 | 39,931 | 38,126 | 36,839 | 36,430 | 37,224 | 39,202 |
| 2003 | 38,531 | 36,572 | 37,153 | 36,240 | 37,714 | 38,020 | 38,791 | 38,169 | 37,052 | 36,869 | 39,759 | 42,278 |
| 2004 | 41,267 | 41,091 | 39,720 | 38,617 | 39,549 | 39,167 | 40,684 | 41,897 | 42,622 | 39,814 | 39,831 | 41,883 |
| 2005 | 42,468 | 40,713 | 39,688 | 39,666 | 39,951 | 39,423 | 41,846 | 39,095 | 37,832 | 39,004 | 41,116 | 41,720 |
| 2006 | 40,238 | 39,292 | 40,114 | 37,576 | 38,632 | 38,373 | 38,033 | 38,485 | 40,949 | 38,029 | 37,582 | 38,563 |
| 2007 | 39,898 | 38,898 | 37,760 | 36,324 | 37,619 | 39,216 | 38,226 | 37,837 | 37,798 | 37,781 | 36,840 | 40,234 |
| 2008 | 41,229 | 41,337 | 35,650 | 35,662 | 36,348 | 36,536 | 37,964 | 36,437 | 33,454 | 34,046 | 35,843 | 38,907 |
| 2009 | 34,063 | 33,595 | 31,048 | 32,590 | 32,037 | 33,731 | 33,930 | 32,443 | 33,583 | 32,607 | 33,048 | 33,144 |
| 2010 | 35,800 | 33,895 | 30,715 | 31,566 | 31,365 | 31,711 | 32,511 | 32,956 | 33,425 | 31,665 | 31,464 | 32,280 |
| 2011 | 35,668 | 33,619 | 34,049 | 33,757 | 34,159 | 33,800 | 35,034 | 33,645 | 34,480 | 34,163 | 34,667 | 35,076 |
| 2012 | 36,211 | 34,552 | 34,698 | 33,965 | 35,016 | 34,616 | 33,508 | 34,845 | 34,996 | 32,908 | 33,249 | 33,745 |
| 2013 | 34,669 | 36,136 | 35,436 | 35,330 | 33,614 | 33,554 | 33,809 | 33,635 | 34,353 | 32,789 | 32,887 | 33,109 |
| 2014 | 32,702 | 35,437 | 34,149 | 34,930 | 35,105 | 34,824 | 34,391 | 34,631 | 34,057 | 33,224 | 33,410 | 35,120 |
| 2015 | 34,863 | 35,040 | 34,712 | 36,031 | 35,636 | 35,524 | 35,954 | 36,930 | 35,363 | 33,905 | 35,047 | 36,273 |
| 2016 | 37,358 | 37,717 | 35,402 | 35,169 | 35,629 | 35,980 | 35,028 | 35,786 | 35,421 | 34,495 | 36,096 | 36,434 |
| 2017 | 37,616 | 36,895 | 34,132 | 35,761 | 36,551 | 36,311 | 35,527 | 34,945 | 34,224 | 33,438 | 34,273 | 34,267 |
| 2018 | 35,716 | 36,548 | 35,502 | 36,300 | 35,670 | 35,886 | 36,066 | 36,585 | 36,302 | 35,086 | 35,926 | 35,887 |
| 2019 | 36,907 | 37,285 | 35,908 | 35,724 | 35,576 | 35,885 | 36,622 | 36,531 | 35,869 | 35,297 | 36,149 | 36,407 |
| 2020 | 37,302 | 37,216 | 35,345 | 37,108 | 38,945 | 38,504 | 38,359 | 36,867 | 36,317 | 35,956 | 36,323 | 37,506 |
| 2021 | 37,443 | 34,988 | 36,093 | 36,710 | 37,635 | 37,831 | 37,744 | 38,324 | 36,204 | 36,454 | 36,571 | 36,682 |
| 2022 | 38,078 | 38,126 | 36,600 | 35,996 | 36,756 | 36,654 | 37,368 | 36,567 | 35,996 | 35,822 | 36,457 | 37,309 |
| 2023 | 37,766 | 36,965 | 35,509 | 35,381 | 35,646 | 36,145 | 36,662 | 36,838 | 37,039 | 35,891 | 36,378 | 37,283 |
| 2024 | 38,403 | |||||||||||
| - = No Data Reported; -- = Not Applicable; NA = Not Available; W = Withheld to avoid disclosure of individual company data. |
| Release Date: 3/29/2024 |
| Next Release Date: 4/30/2024 |