|
Download Data (XLS File) |
|
||||||||
|
||||||||
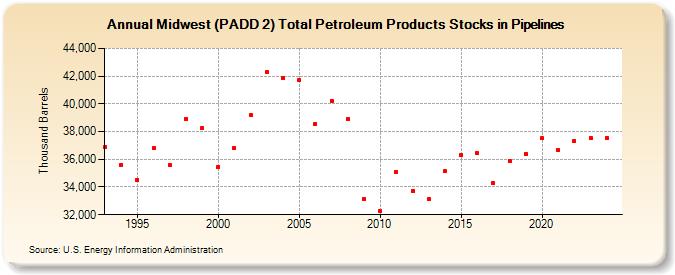
| Midwest (PADD 2) Total Petroleum Products Stocks in Pipelines (Thousand Barrels) | ||||||||
| Decade | Year-0 | Year-1 | Year-2 | Year-3 | Year-4 | Year-5 | Year-6 | Year-7 | Year-8 | Year-9 |
|---|---|---|---|---|---|---|---|---|---|---|
| 1990's | 36,878 | 35,597 | 34,511 | 36,810 | 35,575 | 38,924 | 38,266 | |||
| 2000's | 35,478 | 36,798 | 39,202 | 42,278 | 41,883 | 41,720 | 38,563 | 40,234 | 38,907 | 33,144 |
| 2010's | 32,280 | 35,076 | 33,745 | 33,109 | 35,120 | 36,273 | 36,434 | 34,267 | 35,887 | 36,407 |
| 2020's | 37,506 | 36,682 | 37,309 | 37,283 |
| - = No Data Reported; -- = Not Applicable; NA = Not Available; W = Withheld to avoid disclosure of individual company data. |
| Release Date: 3/29/2024 |
| Next Release Date: 8/30/2024 |