|
Download Data (XLS File) |
|
||||||||
|
||||||||
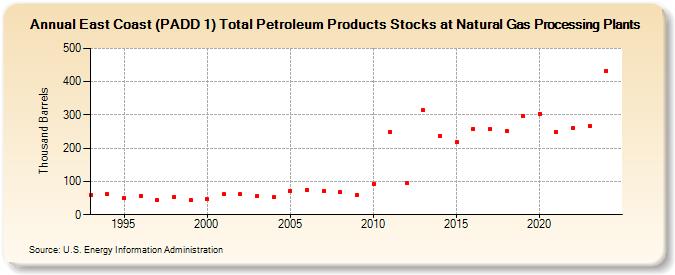
| East Coast (PADD 1) Total Petroleum Products Stocks at Natural Gas Processing Plants (Thousand Barrels) | ||||||||
| Decade | Year-0 | Year-1 | Year-2 | Year-3 | Year-4 | Year-5 | Year-6 | Year-7 | Year-8 | Year-9 |
|---|---|---|---|---|---|---|---|---|---|---|
| 1990's | 58 | 61 | 50 | 57 | 43 | 53 | 43 | |||
| 2000's | 46 | 61 | 61 | 55 | 52 | 72 | 74 | 72 | 67 | 60 |
| 2010's | 93 | 250 | 96 | 314 | 237 | 218 | 258 | 257 | 252 | 298 |
| 2020's | 304 | 248 | 262 | 268 |
| - = No Data Reported; -- = Not Applicable; NA = Not Available; W = Withheld to avoid disclosure of individual company data. |
| Release Date: 3/29/2024 |
| Next Release Date: 8/30/2024 |