|
Download Data (XLS File) |
|
||||||||
|
||||||||
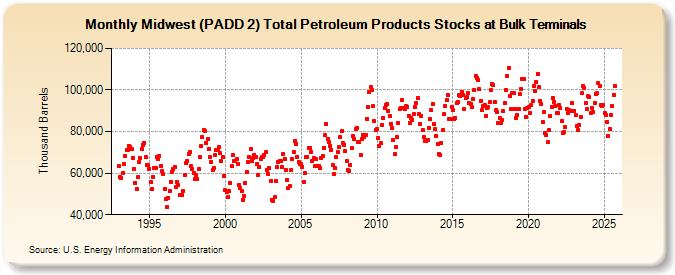
| Midwest (PADD 2) Total Petroleum Products Stocks at Bulk Terminals (Thousand Barrels) | ||||||||
| Year | Jan | Feb | Mar | Apr | May | Jun | Jul | Aug | Sep | Oct | Nov | Dec |
|---|---|---|---|---|---|---|---|---|---|---|---|---|
| 1993 | 63,465 | 58,304 | 57,684 | 60,120 | 64,363 | 68,398 | 71,135 | 71,358 | 73,122 | 72,678 | 71,380 | 67,380 |
| 1994 | 62,160 | 55,350 | 52,134 | 57,981 | 65,154 | 67,149 | 71,479 | 73,515 | 74,701 | 67,778 | 63,777 | 63,693 |
| 1995 | 62,150 | 55,742 | 52,202 | 58,286 | 62,677 | 62,673 | 67,893 | 66,975 | 68,355 | 63,497 | 60,804 | 59,741 |
| 1996 | 52,439 | 47,515 | 43,915 | 48,276 | 51,219 | 55,835 | 60,552 | 61,798 | 63,025 | 53,484 | 55,814 | 54,216 |
| 1997 | 49,386 | 49,383 | 49,637 | 51,460 | 59,026 | 64,871 | 65,912 | 69,294 | 70,261 | 63,267 | 62,058 | 60,003 |
| 1998 | 57,176 | 59,265 | 57,065 | 61,840 | 67,660 | 72,830 | 77,316 | 80,709 | 80,046 | 74,662 | 76,362 | 71,599 |
| 1999 | 67,654 | 65,301 | 61,492 | 62,599 | 68,837 | 70,938 | 71,049 | 72,601 | 69,504 | 65,669 | 67,644 | 58,841 |
| 2000 | 51,732 | 50,799 | 48,291 | 51,257 | 55,377 | 63,324 | 68,682 | 65,822 | 66,029 | 66,591 | 64,499 | 54,287 |
| 2001 | 52,827 | 51,192 | 47,140 | 49,195 | 55,363 | 60,754 | 65,441 | 67,662 | 71,671 | 65,908 | 67,369 | 68,853 |
| 2002 | 67,936 | 64,453 | 59,168 | 62,871 | 66,785 | 67,719 | 67,844 | 68,621 | 69,936 | 61,705 | 59,572 | 62,462 |
| 2003 | 56,257 | 47,051 | 46,620 | 48,340 | 56,016 | 63,037 | 65,547 | 65,983 | 65,616 | 62,865 | 69,084 | 66,883 |
| 2004 | 61,684 | 56,835 | 53,038 | 53,673 | 61,551 | 66,582 | 70,251 | 75,623 | 74,049 | 67,712 | 65,537 | 64,400 |
| 2005 | 64,612 | 63,132 | 55,739 | 59,856 | 67,645 | 67,877 | 71,934 | 72,169 | 70,167 | 65,739 | 67,200 | 63,206 |
| 2006 | 66,622 | 63,343 | 63,552 | 62,670 | 67,366 | 68,406 | 72,225 | 78,121 | 83,626 | 76,580 | 75,110 | 72,980 |
| 2007 | 71,284 | 63,761 | 59,528 | 62,300 | 67,550 | 70,042 | 72,805 | 77,189 | 80,168 | 74,285 | 73,764 | 70,639 |
| 2008 | 65,824 | 61,435 | 61,204 | 63,889 | 72,207 | 77,815 | 76,382 | 81,211 | 81,656 | 74,779 | 74,845 | 68,906 |
| 2009 | 76,408 | 78,471 | 77,210 | 78,305 | 86,048 | 91,747 | 98,920 | 101,611 | 99,985 | 92,323 | 84,932 | 80,692 |
| 2010 | 81,069 | 77,031 | 72,978 | 74,272 | 83,352 | 86,438 | 91,141 | 92,802 | 93,307 | 89,943 | 87,375 | 83,802 |
| 2011 | 81,528 | 75,906 | 69,230 | 72,698 | 77,175 | 84,163 | 90,860 | 91,240 | 95,239 | 91,523 | 90,630 | 92,193 |
| 2012 | 91,840 | 87,488 | 84,102 | 86,351 | 85,561 | 88,291 | 92,007 | 93,526 | 96,246 | 88,257 | 83,804 | 87,407 |
| 2013 | 80,811 | 77,179 | 75,383 | 75,265 | 76,000 | 81,482 | 85,944 | 90,222 | 93,239 | 83,421 | 81,138 | 77,695 |
| 2014 | 74,053 | 69,225 | 68,717 | 74,319 | 80,579 | 88,414 | 92,309 | 95,111 | 97,670 | 86,242 | 85,959 | 91,934 |
| 2015 | 90,230 | 85,925 | 86,454 | 93,645 | 94,300 | 97,377 | 96,950 | 99,197 | 97,636 | 90,958 | 96,375 | 96,601 |
| 2016 | 98,356 | 93,793 | 93,324 | 91,755 | 95,653 | 100,019 | 106,641 | 105,930 | 105,003 | 100,311 | 94,866 | 90,221 |
| 2017 | 92,424 | 92,714 | 87,641 | 91,364 | 91,883 | 93,978 | 99,755 | 102,794 | 102,309 | 94,241 | 90,294 | 89,305 |
| 2018 | 84,238 | 86,388 | 84,067 | 85,760 | 89,739 | 93,589 | 99,938 | 106,959 | 110,641 | 97,182 | 90,826 | 98,734 |
| 2019 | 98,532 | 91,081 | 86,726 | 87,921 | 91,022 | 97,963 | 100,259 | 105,075 | 105,250 | 91,021 | 87,028 | 91,334 |
| 2020 | 91,691 | 88,876 | 92,682 | 94,747 | 101,887 | 99,547 | 103,747 | 107,906 | 101,266 | 94,530 | 93,416 | 84,630 |
| 2021 | 89,436 | 79,141 | 78,348 | 74,828 | 80,686 | 87,385 | 91,794 | 96,032 | 94,356 | 92,522 | 89,019 | 88,778 |
| 2022 | 92,819 | 91,398 | 84,920 | 79,526 | 79,590 | 82,114 | 90,893 | 88,860 | 90,379 | 89,958 | 93,556 | 90,043 |
| 2023 | 89,643 | 87,515 | 82,365 | 80,761 | 82,737 | 86,578 | 98,268 | 101,560 | 101,063 | 93,771 | 90,787 | 96,937 |
| 2024 | 96,734 | |||||||||||
| - = No Data Reported; -- = Not Applicable; NA = Not Available; W = Withheld to avoid disclosure of individual company data. |
| Release Date: 3/29/2024 |
| Next Release Date: 4/30/2024 |