|
Download Data (XLS File) |
|
||||||||
|
||||||||
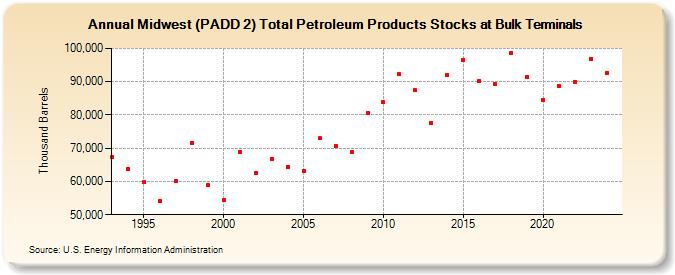
| Midwest (PADD 2) Total Petroleum Products Stocks at Bulk Terminals (Thousand Barrels) | ||||||||
| Decade | Year-0 | Year-1 | Year-2 | Year-3 | Year-4 | Year-5 | Year-6 | Year-7 | Year-8 | Year-9 |
|---|---|---|---|---|---|---|---|---|---|---|
| 1990's | 67,380 | 63,693 | 59,741 | 54,216 | 60,003 | 71,599 | 58,841 | |||
| 2000's | 54,287 | 68,853 | 62,462 | 66,883 | 64,400 | 63,206 | 72,980 | 70,639 | 68,906 | 80,692 |
| 2010's | 83,802 | 92,193 | 87,407 | 77,695 | 91,934 | 96,601 | 90,221 | 89,305 | 98,734 | 91,334 |
| 2020's | 84,630 | 88,778 | 90,043 | 96,937 |
| - = No Data Reported; -- = Not Applicable; NA = Not Available; W = Withheld to avoid disclosure of individual company data. |
| Release Date: 3/29/2024 |
| Next Release Date: 8/30/2024 |