|
Download Data (XLS File) |
|
||||||||
|
||||||||
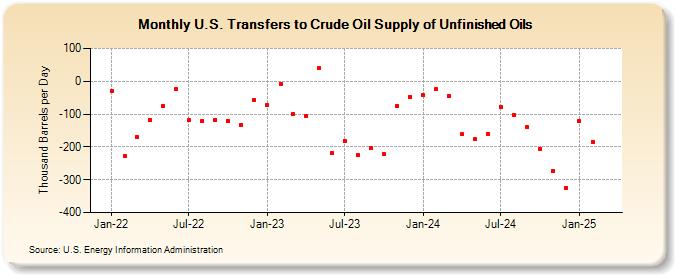
| U.S. Transfers to Crude Oil Supply of Unfinished Oils (Thousand Barrels per Day) | ||||||||
| Year | Jan | Feb | Mar | Apr | May | Jun | Jul | Aug | Sep | Oct | Nov | Dec |
|---|---|---|---|---|---|---|---|---|---|---|---|---|
| 2022 | -29 | -228 | -169 | -117 | -76 | -24 | -119 | -120 | -117 | -120 | -133 | -57 |
| 2023 | -80 | 12 | -87 | -75 | 44 | -200 | -182 | -242 | -187 | -207 | -59 | -52 |
| 2024 | -43 | -24 | ||||||||||
| - = No Data Reported; -- = Not Applicable; NA = Not Available; W = Withheld to avoid disclosure of individual company data. |
| Release Date: 4/30/2024 |
| Next Release Date: 5/31/2024 |
Referring Pages: