|
Download Data (XLS File) |
|
||||||||
|
||||||||
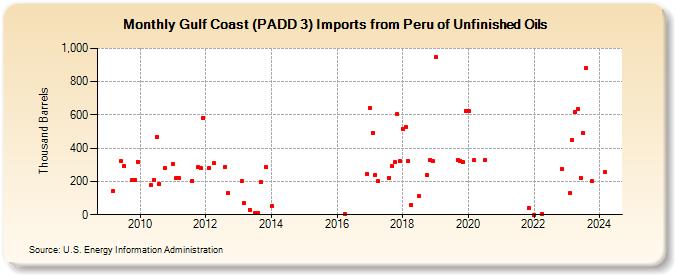
| Gulf Coast (PADD 3) Imports from Peru of Unfinished Oils (Thousand Barrels) | ||||||||
| Year | Jan | Feb | Mar | Apr | May | Jun | Jul | Aug | Sep | Oct | Nov | Dec |
|---|---|---|---|---|---|---|---|---|---|---|---|---|
| 2009 | 140 | 320 | 290 | 209 | 209 | 319 | ||||||
| 2010 | 176 | 209 | 470 | 186 | 280 | |||||||
| 2011 | 306 | 219 | 219 | 205 | 285 | 279 | 584 | |||||
| 2012 | 279 | 309 | 289 | 132 | ||||||||
| 2013 | 200 | 71 | 30 | 9 | 9 | 198 | 284 | |||||
| 2014 | 54 | |||||||||||
| 2016 | 2 | 246 | ||||||||||
| 2017 | 643 | 494 | 241 | 200 | 220 | 290 | 315 | 603 | 320 | |||
| 2018 | 517 | 528 | 324 | 60 | 110 | 238 | 331 | 320 | ||||
| 2019 | 947 | 330 | 323 | 315 | 625 | |||||||
| 2020 | 625 | 327 | 326 | |||||||||
| 2021 | 40 | |||||||||||
| 2022 | 0 | 7 | 277 | |||||||||
| 2023 | 128 | 449 | 615 | 635 | 221 | 490 | 880 | 201 | ||||
| 2024 | 259 | |||||||||||
| - = No Data Reported; -- = Not Applicable; NA = Not Available; W = Withheld to avoid disclosure of individual company data. |
| Release Date: 6/28/2024 |
| Next Release Date: 7/31/2024 |