|
Download Data (XLS File) |
|
||||||||
|
||||||||
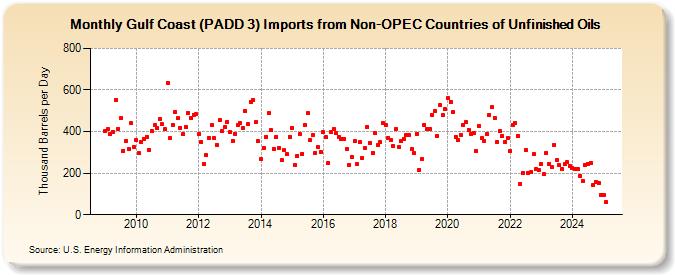
| Gulf Coast (PADD 3) Imports from Non-OPEC Countries of Unfinished Oils (Thousand Barrels per Day) | ||||||||
| Year | Jan | Feb | Mar | Apr | May | Jun | Jul | Aug | Sep | Oct | Nov | Dec |
|---|---|---|---|---|---|---|---|---|---|---|---|---|
| 2009 | 401 | 410 | 388 | 400 | 553 | 414 | 465 | 307 | 354 | 315 | 439 | 326 |
| 2010 | 358 | 295 | 348 | 366 | 375 | 312 | 401 | 430 | 416 | 458 | 435 | 411 |
| 2011 | 634 | 368 | 433 | 495 | 463 | 419 | 386 | 422 | 491 | 467 | 482 | 483 |
| 2012 | 389 | 348 | 245 | 287 | 369 | 431 | 367 | 337 | 455 | 401 | 422 | 447 |
| 2013 | 396 | 355 | 390 | 432 | 439 | 418 | 499 | 435 | 544 | 553 | 447 | 353 |
| 2014 | 266 | 322 | 375 | 489 | 406 | 317 | 374 | 323 | 262 | 310 | 290 | 376 |
| 2015 | 419 | 238 | 284 | 388 | 294 | 430 | 488 | 359 | 382 | 298 | 324 | 302 |
| 2016 | 396 | 373 | 248 | 396 | 412 | 392 | 375 | 366 | 364 | 317 | 240 | 280 |
| 2017 | 353 | 242 | 348 | 274 | 320 | 424 | 347 | 297 | 392 | 336 | 349 | 442 |
| 2018 | 430 | 370 | 361 | 332 | 412 | 325 | 353 | 366 | 383 | 382 | 315 | 296 |
| 2019 | 390 | 217 | 268 | 432 | 414 | 414 | 482 | 499 | 378 | 527 | 480 | 508 |
| 2020 | 559 | 544 | 492 | 375 | 359 | 384 | 433 | 444 | 408 | 386 | 392 | 307 |
| 2021 | 427 | 368 | 355 | 388 | 482 | 516 | 467 | 351 | 401 | 379 | 352 | 368 |
| 2022 | 306 | 433 | 443 | 381 | 150 | 200 | 311 | 201 | 204 | 292 | 222 | 213 |
| 2023 | 244 | 194 | 297 | 253 | 229 | 337 | 261 | 237 | 221 | 242 | 252 | 233 |
| 2024 | 227 | |||||||||||
| - = No Data Reported; -- = Not Applicable; NA = Not Available; W = Withheld to avoid disclosure of individual company data. |
| Release Date: 3/29/2024 |
| Next Release Date: 4/30/2024 |