|
Download Data (XLS File) |
|
||||||||
|
||||||||
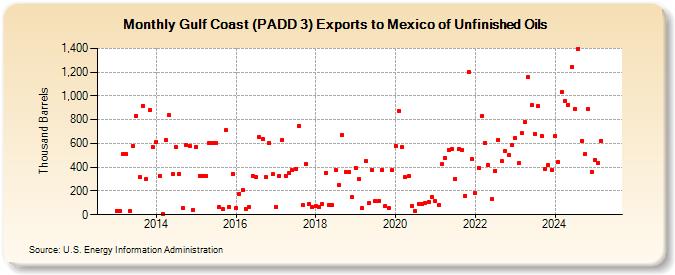
| Gulf Coast (PADD 3) Exports to Mexico of Unfinished Oils (Thousand Barrels) | ||||||||
| Year | Jan | Feb | Mar | Apr | May | Jun | Jul | Aug | Sep | Oct | Nov | Dec |
|---|---|---|---|---|---|---|---|---|---|---|---|---|
| 2013 | 31 | 29 | 507 | 511 | 30 | 577 | 835 | 318 | 919 | 297 | 879 | 570 |
| 2014 | 611 | 329 | 8 | 630 | 836 | 340 | 567 | 345 | 58 | 588 | 581 | 41 |
| 2015 | 571 | 326 | 329 | 327 | 606 | 605 | 604 | 63 | 48 | 709 | 65 | 343 |
| 2016 | 55 | 177 | 206 | 49 | 69 | 328 | 318 | 656 | 640 | 315 | 602 | 339 |
| 2017 | 68 | 329 | 630 | 330 | 350 | 374 | 387 | 749 | 79 | 430 | 87 | 61 |
| 2018 | 74 | 65 | 94 | 354 | 82 | 78 | 377 | 250 | 673 | 361 | 359 | 145 |
| 2019 | 396 | 301 | 55 | 451 | 95 | 380 | 116 | 119 | 378 | 75 | 54 | 374 |
| 2020 | 581 | 876 | 569 | 314 | 322 | 75 | 29 | 92 | 94 | 102 | 110 | 147 |
| 2021 | 113 | 79 | 423 | 479 | 546 | 557 | 303 | 551 | 546 | 161 | 1,201 | 465 |
| 2022 | 181 | 396 | 830 | 606 | 418 | 131 | 371 | 633 | 448 | 540 | 501 | 584 |
| 2023 | 825 | 723 | 787 | 834 | 867 | 869 | 908 | 741 | 684 | 370 | 416 | 378 |
| 2024 | 661 | |||||||||||
| - = No Data Reported; -- = Not Applicable; NA = Not Available; W = Withheld to avoid disclosure of individual company data. |
| Release Date: 3/29/2024 |
| Next Release Date: 4/30/2024 |