|
Download Data (XLS File) |
|
||||||||
|
||||||||
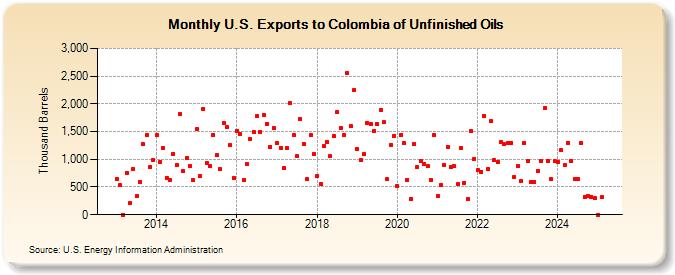
| U.S. Exports to Colombia of Unfinished Oils (Thousand Barrels) | ||||||||
| Year | Jan | Feb | Mar | Apr | May | Jun | Jul | Aug | Sep | Oct | Nov | Dec |
|---|---|---|---|---|---|---|---|---|---|---|---|---|
| 2013 | 652 | 535 | 0 | 758 | 211 | 821 | 329 | 598 | 1,268 | 1,441 | 867 | 989 |
| 2014 | 1,431 | 959 | 1,200 | 671 | 618 | 1,102 | 893 | 1,810 | 780 | 1,026 | 880 | 621 |
| 2015 | 1,544 | 693 | 1,910 | 941 | 882 | 1,438 | 1,069 | 828 | 1,651 | 1,581 | 1,261 | 665 |
| 2016 | 1,510 | 1,452 | 630 | 909 | 1,373 | 1,484 | 1,772 | 1,496 | 1,801 | 1,640 | 1,227 | 1,565 |
| 2017 | 1,285 | 1,212 | 846 | 1,198 | 2,009 | 1,438 | 1,053 | 1,730 | 1,280 | 643 | 1,430 | 1,104 |
| 2018 | 700 | 557 | 1,233 | 1,316 | 1,052 | 1,413 | 1,852 | 1,565 | 1,429 | 2,556 | 1,596 | 2,252 |
| 2019 | 1,184 | 986 | 1,094 | 1,650 | 1,638 | 1,505 | 1,640 | 1,887 | 1,667 | 639 | 1,263 | 1,427 |
| 2020 | 518 | 1,436 | 1,286 | 633 | 292 | 1,284 | 853 | 960 | 919 | 873 | 629 | 1,431 |
| 2021 | 333 | 542 | 899 | 1,224 | 862 | 870 | 546 | 1,205 | 574 | 281 | 1,502 | 1,006 |
| 2022 | 804 | 779 | 1,785 | 828 | 1,686 | 984 | 957 | 1,308 | 1,270 | 1,289 | 1,297 | 681 |
| 2023 | 931 | 603 | 1,290 | 972 | 593 | 593 | 797 | 962 | 1,916 | 965 | 644 | 961 |
| 2024 | 953 | |||||||||||
| - = No Data Reported; -- = Not Applicable; NA = Not Available; W = Withheld to avoid disclosure of individual company data. |
| Release Date: 3/29/2024 |
| Next Release Date: 4/30/2024 |