|
Download Data (XLS File) |
|
||||||||
|
||||||||
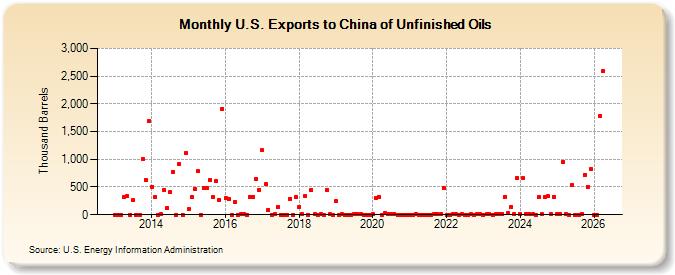
| U.S. Exports to China of Unfinished Oils (Thousand Barrels) | ||||||||
| Year | Jan | Feb | Mar | Apr | May | Jun | Jul | Aug | Sep | Oct | Nov | Dec |
|---|---|---|---|---|---|---|---|---|---|---|---|---|
| 2013 | 0 | 0 | 0 | 325 | 336 | 0 | 258 | 0 | 0 | 1,000 | 629 | 1,691 |
| 2014 | 500 | 318 | 0 | 6 | 451 | 128 | 405 | 774 | 0 | 922 | 1 | 1,110 |
| 2015 | 102 | 322 | 463 | 783 | 1 | 476 | 480 | 635 | 319 | 609 | 273 | 1,909 |
| 2016 | 299 | 280 | 3 | 233 | 2 | 4 | 6 | 0 | 322 | 325 | 642 | 450 |
| 2017 | 1,161 | 545 | 86 | 2 | 4 | 147 | 0 | 1 | 1 | 284 | 0 | 319 |
| 2018 | 141 | 5 | 330 | 1 | 451 | 4 | 1 | 6 | 2 | 452 | 6 | 1 |
| 2019 | 242 | 2 | 5 | 2 | 2 | 2 | 4 | 5 | 10 | 1 | 1 | 1 |
| 2020 | 6 | 303 | 326 | 2 | 25 | 20 | 4 | 9 | 3 | 3 | 3 | 1 |
| 2021 | 2 | 3 | 13 | 0 | 2 | 1 | 1 | 0 | 4 | 4 | 8 | 488 |
| 2022 | 1 | 2 | 6 | 4 | 2 | 5 | 3 | 2 | 5 | 2 | 5 | 12 |
| 2023 | 3 | 4 | 13 | 2 | 9 | 8 | 7 | 328 | 22 | 152 | 2 | 660 |
| 2024 | 9 | |||||||||||
| - = No Data Reported; -- = Not Applicable; NA = Not Available; W = Withheld to avoid disclosure of individual company data. |
| Release Date: 3/29/2024 |
| Next Release Date: 4/30/2024 |