|
Download Data (XLS File) |
|
||||||||
|
||||||||
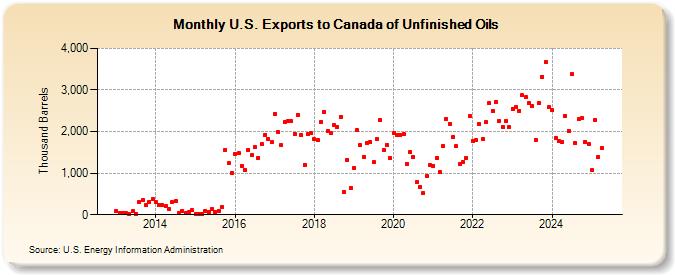
| U.S. Exports to Canada of Unfinished Oils (Thousand Barrels) | ||||||||
| Year | Jan | Feb | Mar | Apr | May | Jun | Jul | Aug | Sep | Oct | Nov | Dec |
|---|---|---|---|---|---|---|---|---|---|---|---|---|
| 2013 | 95 | 36 | 34 | 40 | 27 | 84 | 20 | 303 | 348 | 244 | 313 | 373 |
| 2014 | 295 | 236 | 224 | 201 | 143 | 309 | 327 | 32 | 93 | 36 | 57 | 102 |
| 2015 | 21 | 18 | 29 | 92 | 73 | 143 | 73 | 93 | 180 | 1,568 | 1,233 | 1,006 |
| 2016 | 1,468 | 1,477 | 1,180 | 1,081 | 1,565 | 1,433 | 1,618 | 1,373 | 1,695 | 1,919 | 1,815 | 1,738 |
| 2017 | 2,430 | 1,985 | 1,665 | 2,238 | 2,242 | 2,242 | 1,952 | 2,405 | 1,929 | 1,196 | 1,930 | 1,959 |
| 2018 | 1,815 | 1,789 | 2,232 | 2,481 | 2,009 | 1,957 | 2,146 | 2,113 | 2,356 | 542 | 1,324 | 644 |
| 2019 | 1,132 | 2,026 | 1,676 | 1,400 | 1,732 | 1,743 | 1,260 | 1,824 | 2,281 | 1,559 | 1,685 | 1,360 |
| 2020 | 1,964 | 1,913 | 1,918 | 1,939 | 1,222 | 1,505 | 1,387 | 784 | 670 | 520 | 926 | 1,192 |
| 2021 | 1,179 | 1,366 | 1,017 | 1,641 | 2,296 | 2,183 | 1,857 | 1,645 | 1,225 | 1,268 | 1,368 | 2,367 |
| 2022 | 1,776 | 1,800 | 2,179 | 1,826 | 2,222 | 2,676 | 2,495 | 2,717 | 2,258 | 2,112 | 2,251 | 2,108 |
| 2023 | 2,441 | 2,408 | 2,418 | 2,707 | 2,739 | 2,681 | 2,615 | 1,808 | 2,678 | 3,318 | 3,671 | 2,593 |
| 2024 | 2,512 | |||||||||||
| - = No Data Reported; -- = Not Applicable; NA = Not Available; W = Withheld to avoid disclosure of individual company data. |
| Release Date: 3/29/2024 |
| Next Release Date: 4/30/2024 |