|
Download Data (XLS File) |
|
||||||||
|
||||||||
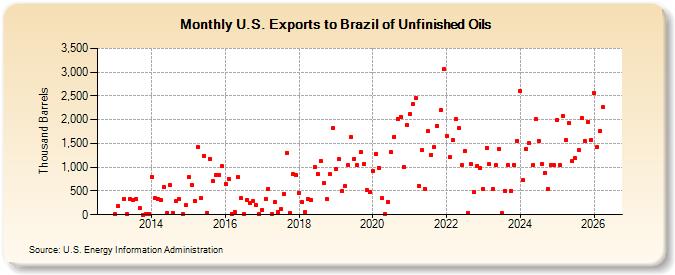
| U.S. Exports to Brazil of Unfinished Oils (Thousand Barrels) | ||||||||
| Year | Jan | Feb | Mar | Apr | May | Jun | Jul | Aug | Sep | Oct | Nov | Dec |
|---|---|---|---|---|---|---|---|---|---|---|---|---|
| 2013 | 9 | 183 | 337 | 6 | 335 | 318 | 326 | 138 | 0 | 10 | 5 | |
| 2014 | 804 | 352 | 325 | 306 | 577 | 36 | 616 | 36 | 294 | 324 | 6 | 199 |
| 2015 | 787 | 633 | 280 | 1,423 | 354 | 1,236 | 41 | 1,181 | 704 | 840 | 840 | 1,019 |
| 2016 | 651 | 754 | 22 | 57 | 791 | 343 | 7 | 316 | 249 | 285 | 202 | 12 |
| 2017 | 103 | 338 | 550 | 9 | 269 | 55 | 116 | 442 | 1,305 | 42 | 859 | 828 |
| 2018 | 464 | 259 | 50 | 333 | 309 | 1,002 | 859 | 1,138 | 664 | 333 | 847 | 1,817 |
| 2019 | 955 | 1,166 | 507 | 603 | 1,038 | 1,635 | 1,178 | 1,040 | 1,317 | 1,063 | 519 | 471 |
| 2020 | 916 | 1,282 | 990 | 350 | 14 | 275 | 1,312 | 1,641 | 2,011 | 2,060 | 1,003 | 1,880 |
| 2021 | 2,115 | 2,335 | 2,455 | 613 | 1,360 | 537 | 1,754 | 1,267 | 1,417 | 1,864 | 2,194 | 3,061 |
| 2022 | 1,660 | 1,206 | 1,563 | 2,011 | 1,815 | 1,037 | 1,338 | 33 | 1,063 | 483 | 1,031 | 974 |
| 2023 | 536 | 1,420 | 1,067 | 540 | 1,040 | 1,378 | 39 | 999 | 1,040 | 500 | 1,055 | 1,559 |
| 2024 | 2,596 | |||||||||||
| - = No Data Reported; -- = Not Applicable; NA = Not Available; W = Withheld to avoid disclosure of individual company data. |
| Release Date: 3/29/2024 |
| Next Release Date: 4/30/2024 |