|
Download Data (XLS File) |
|
||||||||
|
||||||||
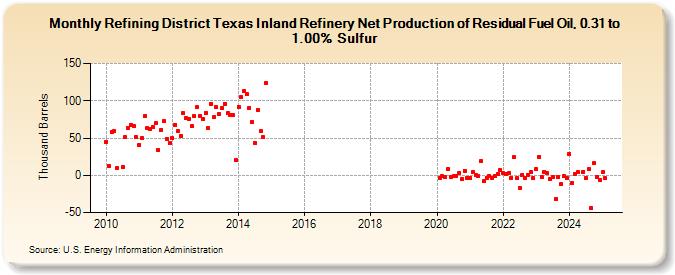
| Refining District Texas Inland Refinery Net Production of Residual Fuel Oil, 0.31 to 1.00% Sulfur (Thousand Barrels) | ||||||||
| Year | Jan | Feb | Mar | Apr | May | Jun | Jul | Aug | Sep | Oct | Nov | Dec |
|---|---|---|---|---|---|---|---|---|---|---|---|---|
| 2010 | 45 | 13 | 58 | 59 | 10 | 11 | 51 | 64 | 68 | 66 | 51 | |
| 2011 | 41 | 50 | 79 | 63 | 62 | 65 | 70 | 34 | 61 | 73 | 49 | 43 |
| 2012 | 50 | 68 | 59 | 53 | 83 | 77 | 76 | 66 | 79 | 91 | 80 | 76 |
| 2013 | 84 | 63 | 96 | 78 | 91 | 82 | 90 | 96 | 83 | 81 | 81 | 20 |
| 2014 | 92 | 105 | 113 | 109 | 90 | 72 | 43 | 88 | 59 | 51 | 124 | |
| 2020 | -3 | -1 | -2 | 8 | -2 | -1 | -1 | 3 | -5 | 6 | -3 | |
| 2021 | -3 | 4 | 1 | -1 | 19 | -8 | -3 | -1 | -4 | -1 | 2 | 7 |
| 2022 | 3 | 2 | 3 | -3 | 24 | -4 | -17 | 1 | -3 | 1 | 4 | -4 |
| 2023 | 8 | 25 | -2 | 4 | 3 | -5 | -2 | -32 | -2 | -12 | -1 | -4 |
| 2024 | 29 | |||||||||||
| - = No Data Reported; -- = Not Applicable; NA = Not Available; W = Withheld to avoid disclosure of individual company data. |
| Release Date: 3/29/2024 |
| Next Release Date: 4/30/2024 |