|
Download Data (XLS File) |
|
||||||||
|
||||||||
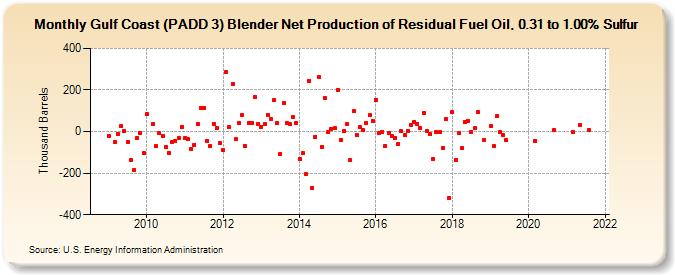
| Gulf Coast (PADD 3) Blender Net Production of Residual Fuel Oil, 0.31 to 1.00% Sulfur (Thousand Barrels) | ||||||||
| Year | Jan | Feb | Mar | Apr | May | Jun | Jul | Aug | Sep | Oct | Nov | Dec |
|---|---|---|---|---|---|---|---|---|---|---|---|---|
| 2009 | -20 | -52 | -12 | 26 | 2 | -51 | -135 | -183 | -31 | -6 | -105 | |
| 2010 | 83 | 34 | -71 | -5 | -21 | -72 | -101 | -52 | -46 | -31 | 24 | |
| 2011 | -32 | -36 | -86 | -63 | 37 | 114 | 113 | -44 | -69 | 38 | 16 | -57 |
| 2012 | -89 | 287 | 22 | 227 | -38 | 41 | 80 | -71 | 40 | 43 | 166 | 37 |
| 2013 | 24 | 37 | 81 | 58 | 151 | 39 | -107 | 138 | 39 | 35 | 68 | 43 |
| 2014 | -130 | -104 | -206 | 245 | -270 | -24 | 260 | -74 | 160 | -4 | 14 | 15 |
| 2015 | 200 | -41 | 4 | 34 | -137 | 97 | -15 | 20 | 6 | 40 | 78 | 52 |
| 2016 | 154 | -6 | 0 | -69 | -8 | -22 | -30 | -58 | 1 | -15 | 2 | 31 |
| 2017 | 46 | 38 | 17 | 90 | 4 | -14 | -131 | -3 | -1 | -81 | 58 | -321 |
| 2018 | 92 | -135 | -9 | -78 | 48 | 53 | -2 | 15 | 94 | -43 | ||
| 2019 | 25 | -70 | 73 | -4 | -16 | -40 | ||||||
| 2020 | -44 | 7 | ||||||||||
| 2021 | -3 | 30 | 6 | |||||||||
| - = No Data Reported; -- = Not Applicable; NA = Not Available; W = Withheld to avoid disclosure of individual company data. |
| Release Date: 8/30/2024 |
| Next Release Date: 9/30/2024 |