|
Download Data (XLS File) |
|
||||||||
|
||||||||
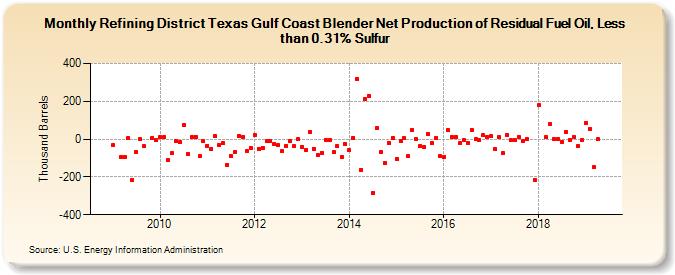
| Refining District Texas Gulf Coast Blender Net Production of Residual Fuel Oil, Less than 0.31% Sulfur (Thousand Barrels) | ||||||||
| Year | Jan | Feb | Mar | Apr | May | Jun | Jul | Aug | Sep | Oct | Nov | Dec |
|---|---|---|---|---|---|---|---|---|---|---|---|---|
| 2009 | -32 | -97 | -95 | 5 | -217 | -66 | -2 | -39 | 6 | -7 | ||
| 2010 | 12 | 11 | -112 | -75 | -12 | -17 | 75 | -78 | 12 | 13 | -92 | -12 |
| 2011 | -34 | -51 | 14 | -30 | -22 | -135 | -92 | -68 | 18 | 13 | -65 | -46 |
| 2012 | 22 | -50 | -45 | -12 | -9 | -26 | -33 | -65 | -36 | -10 | -39 | -1 |
| 2013 | -40 | -56 | 39 | -50 | -83 | -71 | -4 | -5 | -67 | -39 | -94 | -27 |
| 2014 | -59 | 7 | 320 | -162 | 214 | 230 | -283 | 61 | -70 | -127 | -19 | 6 |
| 2015 | -103 | -8 | 4 | -92 | 50 | -1 | -36 | -44 | 28 | -21 | 8 | -91 |
| 2016 | -95 | 46 | 12 | 11 | -23 | -5 | -21 | 50 | -1 | -6 | 20 | 11 |
| 2017 | 16 | -54 | 10 | -76 | 21 | -5 | -6 | 12 | -10 | -1 | -214 | |
| 2018 | 179 | 9 | 78 | 2 | -1 | -13 | 38 | -3 | 10 | -36 | -3 | |
| 2019 | 86 | 54 | -149 | -2 | ||||||||
| - = No Data Reported; -- = Not Applicable; NA = Not Available; W = Withheld to avoid disclosure of individual company data. |
| Release Date: 8/30/2024 |
| Next Release Date: 9/30/2024 |