|
Download Data (XLS File) |
|
||||||||
|
||||||||
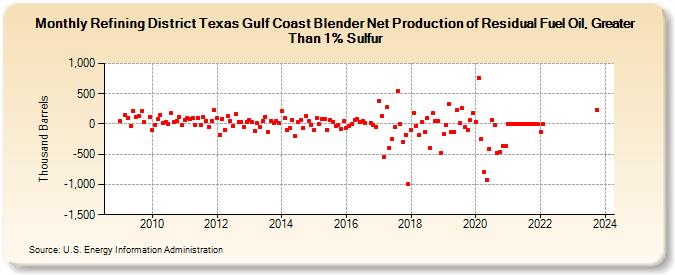
| Refining District Texas Gulf Coast Blender Net Production of Residual Fuel Oil, Greater Than 1% Sulfur (Thousand Barrels) | ||||||||
| Year | Jan | Feb | Mar | Apr | May | Jun | Jul | Aug | Sep | Oct | Nov | Dec |
|---|---|---|---|---|---|---|---|---|---|---|---|---|
| 2009 | 52 | 149 | 107 | -30 | 215 | 117 | 137 | 222 | 31 | 112 | ||
| 2010 | -95 | -11 | 78 | 146 | 17 | 38 | -3 | 179 | 40 | 52 | 123 | -12 |
| 2011 | 67 | 91 | 76 | 93 | -14 | 101 | -21 | 116 | 51 | -51 | 49 | 227 |
| 2012 | 97 | -174 | 89 | -102 | 126 | 51 | -39 | 158 | 37 | 33 | -58 | 33 |
| 2013 | 63 | 26 | -112 | 11 | -55 | 48 | 123 | -131 | 53 | 23 | 52 | 16 |
| 2014 | 217 | 100 | -101 | -61 | 58 | -196 | 27 | 58 | -69 | 137 | 46 | -20 |
| 2015 | -96 | 91 | -8 | 75 | 87 | -96 | 69 | 34 | -26 | -19 | -86 | 49 |
| 2016 | -59 | -40 | -4 | 58 | 77 | 27 | 51 | 8 | 21 | -22 | -42 | |
| 2017 | 383 | 128 | -546 | 275 | -391 | -245 | -53 | 551 | -5 | -300 | -174 | -1,000 |
| 2018 | -92 | 178 | -26 | -177 | 39 | -127 | 101 | -402 | 178 | 45 | 46 | -475 |
| 2019 | -162 | -14 | 335 | -140 | -126 | 224 | 11 | 257 | -48 | -92 | 64 | 187 |
| 2020 | 32 | 767 | -253 | -788 | -918 | -407 | 65 | -25 | -477 | -465 | -363 | -365 |
| 2021 | 0 | 0 | 0 | 0 | 0 | 0 | 0 | 0 | 0 | 0 | 0 | 0 |
| 2022 | -133 | 0 | ||||||||||
| 2023 | 229 | |||||||||||
| 2024 | -26 | -6 | 25 | |||||||||
| - = No Data Reported; -- = Not Applicable; NA = Not Available; W = Withheld to avoid disclosure of individual company data. |
| Release Date: 8/30/2024 |
| Next Release Date: 9/30/2024 |