|
Download Data (XLS File) |
|
||||||||
|
||||||||
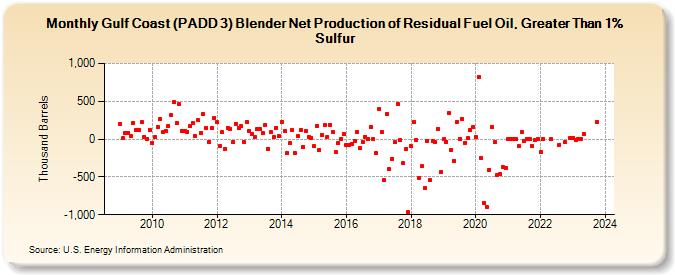
| Gulf Coast (PADD 3) Blender Net Production of Residual Fuel Oil, Greater Than 1% Sulfur (Thousand Barrels) | ||||||||
| Year | Jan | Feb | Mar | Apr | May | Jun | Jul | Aug | Sep | Oct | Nov | Dec |
|---|---|---|---|---|---|---|---|---|---|---|---|---|
| 2009 | 201 | 8 | 82 | 85 | 40 | 216 | 118 | 126 | 222 | 31 | -1 | 126 |
| 2010 | -51 | 25 | 160 | 264 | 91 | 112 | 175 | 318 | 489 | 207 | 459 | 103 |
| 2011 | 110 | 100 | 171 | 215 | 38 | 246 | 79 | 329 | 151 | -33 | 151 | 279 |
| 2012 | 221 | -94 | 89 | -131 | 153 | 137 | -39 | 205 | 148 | 176 | -34 | 225 |
| 2013 | 110 | 63 | 23 | 134 | 136 | 75 | 183 | -126 | 88 | 25 | 151 | 46 |
| 2014 | 231 | 105 | -190 | -52 | 115 | -188 | 35 | 117 | -109 | 112 | 29 | 18 |
| 2015 | -97 | 170 | -142 | 59 | 185 | 28 | 192 | 96 | -169 | -51 | 4 | 67 |
| 2016 | -76 | -76 | -60 | -19 | 91 | -120 | -37 | 34 | 2 | 165 | 1 | -189 |
| 2017 | 394 | 100 | -545 | 330 | -397 | -257 | -41 | 467 | -18 | -321 | -132 | -969 |
| 2018 | -94 | 227 | -11 | -514 | -360 | -647 | -21 | -540 | -30 | -44 | 140 | -439 |
| 2019 | -2 | -35 | 347 | -145 | -285 | 227 | 5 | 267 | -46 | 13 | 123 | 159 |
| 2020 | 32 | 818 | -247 | -841 | -894 | -404 | 158 | -43 | -474 | -465 | -363 | -386 |
| 2021 | 0 | -3 | 1 | 0 | -95 | 96 | -31 | 2 | 0 | -93 | -15 | -1 |
| 2022 | -174 | 0 | 0 | -72 | -41 | 17 | ||||||
| 2023 | 14 | -9 | 1 | -5 | 72 | 229 | ||||||
| 2024 | 70 | -6 | 25 | |||||||||
| - = No Data Reported; -- = Not Applicable; NA = Not Available; W = Withheld to avoid disclosure of individual company data. |
| Release Date: 8/30/2024 |
| Next Release Date: 9/30/2024 |