|
Download Data (XLS File) |
|
||||||||
|
||||||||
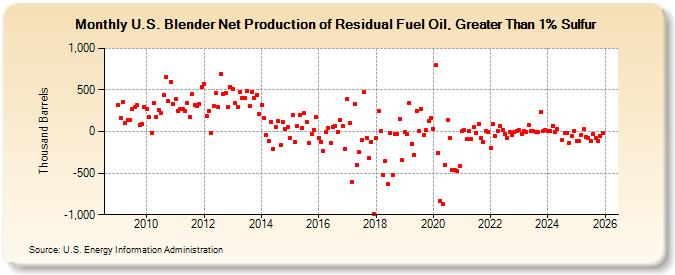
| U.S. Blender Net Production of Residual Fuel Oil, Greater Than 1% Sulfur (Thousand Barrels) | ||||||||
| Year | Jan | Feb | Mar | Apr | May | Jun | Jul | Aug | Sep | Oct | Nov | Dec |
|---|---|---|---|---|---|---|---|---|---|---|---|---|
| 2009 | 318 | 166 | 350 | 103 | 136 | 138 | 266 | 290 | 315 | 84 | 92 | 293 |
| 2010 | 274 | 174 | -16 | 346 | 170 | 261 | 224 | 436 | 656 | 367 | 601 | 329 |
| 2011 | 395 | 248 | 273 | 276 | 244 | 343 | 180 | 453 | 320 | 306 | 332 | 538 |
| 2012 | 576 | 184 | 246 | -16 | 310 | 459 | 290 | 694 | 448 | 462 | 293 | 535 |
| 2013 | 514 | 349 | 296 | 470 | 409 | 401 | 484 | 310 | 476 | 400 | 440 | 211 |
| 2014 | 325 | 160 | -43 | -112 | 118 | -205 | 53 | 121 | -167 | 114 | 31 | 50 |
| 2015 | -72 | 199 | -122 | 69 | 199 | 48 | 218 | 112 | -143 | -29 | 22 | 179 |
| 2016 | -74 | -120 | -234 | -2 | 46 | -134 | 56 | 72 | -4 | 138 | 72 | -208 |
| 2017 | 392 | 106 | -605 | 328 | -407 | -248 | -107 | 474 | -72 | -322 | -127 | -989 |
| 2018 | -82 | 243 | 6 | -521 | -353 | -634 | -19 | -527 | -25 | -27 | 145 | -347 |
| 2019 | -3 | -32 | 348 | -144 | -281 | 251 | 5 | 267 | -38 | 13 | 125 | 161 |
| 2020 | 35 | 797 | -253 | -838 | -876 | -397 | 134 | -79 | -468 | -466 | -477 | -412 |
| 2021 | 2 | 13 | -85 | 4 | -92 | 54 | -22 | 96 | -81 | -125 | 5 | 0 |
| 2022 | -202 | 87 | -55 | 9 | 68 | 15 | -27 | -74 | -1 | -40 | -3 | 6 |
| 2023 | 13 | -30 | 4 | -6 | 73 | 6 | 1 | -11 | -8 | 235 | 3 | 17 |
| 2024 | 2 | |||||||||||
| - = No Data Reported; -- = Not Applicable; NA = Not Available; W = Withheld to avoid disclosure of individual company data. |
| Release Date: 3/29/2024 |
| Next Release Date: 4/30/2024 |