|
Download Data (XLS File) |
|
||||||||
|
||||||||
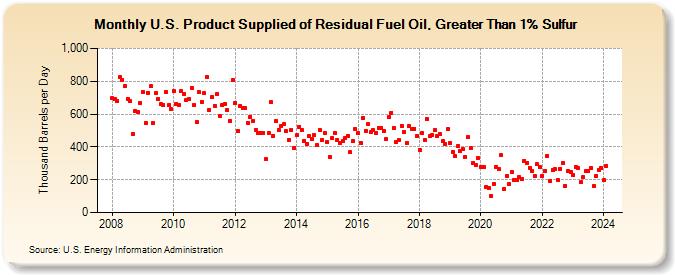
| U.S. Product Supplied of Residual Fuel Oil, Greater Than 1% Sulfur (Thousand Barrels per Day) | ||||||||
| Year | Jan | Feb | Mar | Apr | May | Jun | Jul | Aug | Sep | Oct | Nov | Dec |
|---|---|---|---|---|---|---|---|---|---|---|---|---|
| 2008 | 695 | 690 | 682 | 824 | 809 | 770 | 693 | 679 | 478 | 619 | 611 | 668 |
| 2009 | 733 | 547 | 730 | 768 | 548 | 726 | 693 | 661 | 658 | 735 | 654 | 632 |
| 2010 | 739 | 664 | 658 | 740 | 721 | 685 | 692 | 761 | 655 | 549 | 733 | 675 |
| 2011 | 726 | 823 | 625 | 703 | 652 | 721 | 591 | 654 | 662 | 625 | 558 | 806 |
| 2012 | 668 | 497 | 647 | 638 | 634 | 547 | 585 | 558 | 503 | 483 | 482 | 485 |
| 2013 | 324 | 485 | 673 | 468 | 557 | 502 | 530 | 537 | 496 | 443 | 502 | 392 |
| 2014 | 470 | 523 | 501 | 435 | 419 | 465 | 449 | 472 | 409 | 503 | 443 | 484 |
| 2015 | 431 | 339 | 453 | 482 | 444 | 424 | 433 | 454 | 467 | 366 | 435 | 508 |
| 2016 | 483 | 426 | 577 | 499 | 537 | 490 | 501 | 487 | 517 | 516 | 496 | 446 |
| 2017 | 581 | 608 | 517 | 427 | 445 | 530 | 489 | 425 | 525 | 511 | 511 | 466 |
| 2018 | 384 | 485 | 443 | 570 | 464 | 471 | 500 | 464 | 478 | 433 | 417 | 507 |
| 2019 | 423 | 370 | 342 | 404 | 374 | 388 | 338 | 459 | 391 | 302 | 288 | 331 |
| 2020 | 280 | 275 | 157 | 152 | 102 | 177 | 279 | 265 | 349 | 142 | 224 | 173 |
| 2021 | 249 | 198 | 200 | 216 | 202 | 317 | 303 | 273 | 253 | 224 | 293 | 275 |
| 2022 | 224 | 255 | 347 | 191 | 260 | 265 | 197 | 268 | 302 | 162 | 252 | 247 |
| 2023 | 228 | 278 | 271 | 185 | 214 | 251 | 253 | 273 | 161 | 225 | 260 | 271 |
| 2024 | 198 | |||||||||||
| - = No Data Reported; -- = Not Applicable; NA = Not Available; W = Withheld to avoid disclosure of individual company data. |
| Release Date: 3/29/2024 |
| Next Release Date: 4/30/2024 |