|
Download Data (XLS File) |
|
||||||||
|
||||||||
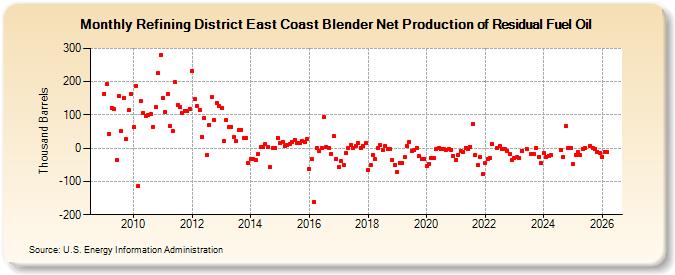
| Refining District East Coast Blender Net Production of Residual Fuel Oil (Thousand Barrels) | ||||||||
| Year | Jan | Feb | Mar | Apr | May | Jun | Jul | Aug | Sep | Oct | Nov | Dec |
|---|---|---|---|---|---|---|---|---|---|---|---|---|
| 2009 | 164 | 192 | 44 | 122 | 117 | -37 | 157 | 51 | 151 | 27 | 114 | 164 |
| 2010 | 63 | 188 | -113 | 141 | 106 | 96 | 101 | 102 | 65 | 123 | 225 | 280 |
| 2011 | 152 | 110 | 164 | 68 | 53 | 198 | 130 | 123 | 106 | 112 | 112 | 119 |
| 2012 | 232 | 148 | 128 | 115 | 35 | 90 | -21 | 70 | 154 | 84 | 136 | 126 |
| 2013 | 122 | 22 | 85 | 63 | 65 | 33 | 21 | 55 | 55 | 31 | 32 | -46 |
| 2014 | -32 | -33 | -37 | -18 | 3 | 5 | 12 | 4 | -58 | 2 | 2 | 32 |
| 2015 | 17 | 18 | 7 | 9 | 14 | 20 | 26 | 16 | 16 | 21 | 18 | 29 |
| 2016 | -63 | -34 | -161 | 1 | -9 | 2 | 93 | 4 | 1 | -17 | 36 | -33 |
| 2017 | -57 | -38 | -52 | -15 | 0 | 11 | 1 | 8 | 15 | 1 | 7 | 15 |
| 2018 | -65 | -50 | -21 | -34 | 0 | 9 | -4 | 7 | -1 | -3 | -36 | -50 |
| 2019 | -73 | -44 | -45 | -28 | 6 | 20 | -7 | -6 | 2 | -24 | -33 | -32 |
| 2020 | -55 | -49 | -30 | -31 | -1 | 1 | -1 | -2 | -4 | -2 | -4 | -23 |
| 2021 | -36 | -19 | -8 | -11 | 2 | -1 | 5 | 72 | -20 | -52 | -26 | -79 |
| 2022 | -46 | -33 | -29 | 12 | 0 | 7 | -3 | -2 | -7 | -18 | -37 | |
| 2023 | -29 | -27 | -29 | -7 | -1 | -16 | -18 | 0 | -28 | -44 | ||
| 2024 | -13 | |||||||||||
| - = No Data Reported; -- = Not Applicable; NA = Not Available; W = Withheld to avoid disclosure of individual company data. |
| Release Date: 3/29/2024 |
| Next Release Date: 4/30/2024 |