|
Download Data (XLS File) |
|
||||||||
|
||||||||
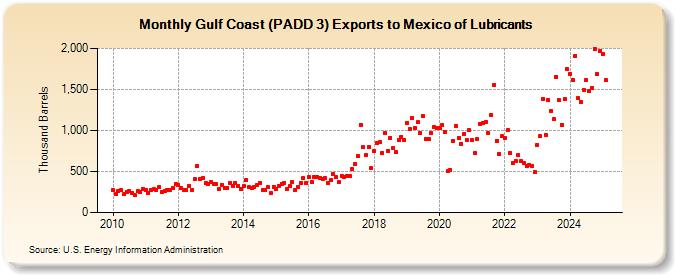
| Gulf Coast (PADD 3) Exports to Mexico of Lubricants (Thousand Barrels) | ||||||||
| Year | Jan | Feb | Mar | Apr | May | Jun | Jul | Aug | Sep | Oct | Nov | Dec |
|---|---|---|---|---|---|---|---|---|---|---|---|---|
| 2010 | 276 | 224 | 265 | 272 | 221 | 251 | 263 | 240 | 210 | 258 | 253 | 291 |
| 2011 | 273 | 243 | 274 | 282 | 271 | 308 | 256 | 265 | 277 | 274 | 305 | 350 |
| 2012 | 341 | 298 | 273 | 278 | 325 | 279 | 404 | 573 | 412 | 425 | 360 | 346 |
| 2013 | 375 | 346 | 349 | 292 | 340 | 295 | 304 | 365 | 329 | 364 | 324 | 283 |
| 2014 | 320 | 398 | 307 | 304 | 315 | 338 | 362 | 273 | 270 | 311 | 233 | 315 |
| 2015 | 283 | 329 | 354 | 365 | 281 | 322 | 372 | 270 | 313 | 361 | 421 | 362 |
| 2016 | 430 | 378 | 438 | 435 | 427 | 410 | 418 | 355 | 393 | 467 | 432 | 367 |
| 2017 | 450 | 433 | 446 | 449 | 530 | 597 | 689 | 1,067 | 798 | 701 | 797 | 543 |
| 2018 | 749 | 843 | 855 | 729 | 968 | 750 | 912 | 782 | 734 | 879 | 925 | 887 |
| 2019 | 1,096 | 1,021 | 1,156 | 1,029 | 1,100 | 967 | 1,171 | 899 | 897 | 971 | 1,043 | 1,028 |
| 2020 | 1,034 | 1,061 | 982 | 501 | 518 | 875 | 1,055 | 914 | 840 | 954 | 879 | 1,001 |
| 2021 | 888 | 721 | 892 | 1,083 | 1,095 | 1,108 | 967 | 1,192 | 1,553 | 876 | 719 | 929 |
| 2022 | 908 | 1,003 | 726 | 604 | 628 | 704 | 626 | 608 | 563 | 579 | 571 | 497 |
| 2023 | 832 | 930 | 1,391 | 946 | 1,352 | 1,234 | 1,135 | 1,672 | 1,341 | 1,079 | 1,386 | 1,740 |
| 2024 | 1,693 | |||||||||||
| - = No Data Reported; -- = Not Applicable; NA = Not Available; W = Withheld to avoid disclosure of individual company data. |
| Release Date: 3/29/2024 |
| Next Release Date: 4/30/2024 |