|
Download Data (XLS File) |
|
||||||||
|
||||||||
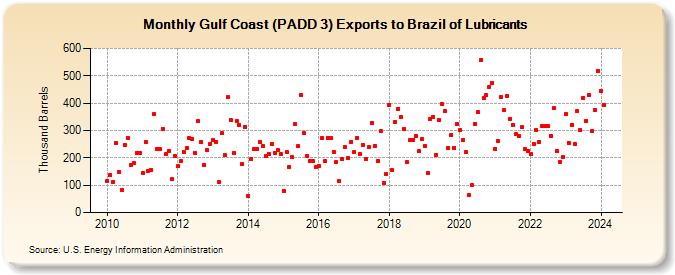
| Gulf Coast (PADD 3) Exports to Brazil of Lubricants (Thousand Barrels) | ||||||||
| Year | Jan | Feb | Mar | Apr | May | Jun | Jul | Aug | Sep | Oct | Nov | Dec |
|---|---|---|---|---|---|---|---|---|---|---|---|---|
| 2010 | 117 | 137 | 112 | 255 | 150 | 84 | 247 | 274 | 174 | 182 | 219 | 217 |
| 2011 | 144 | 257 | 152 | 157 | 359 | 234 | 231 | 307 | 213 | 225 | 121 | 206 |
| 2012 | 170 | 188 | 222 | 235 | 273 | 269 | 218 | 333 | 259 | 173 | 228 | 252 |
| 2013 | 265 | 258 | 110 | 289 | 210 | 422 | 338 | 219 | 333 | 320 | 177 | 314 |
| 2014 | 61 | 197 | 231 | 234 | 257 | 242 | 207 | 215 | 250 | 219 | 227 | 214 |
| 2015 | 80 | 221 | 168 | 202 | 323 | 242 | 431 | 289 | 206 | 187 | 187 | 165 |
| 2016 | 171 | 272 | 187 | 274 | 272 | 223 | 184 | 114 | 197 | 239 | 198 | 259 |
| 2017 | 221 | 274 | 213 | 248 | 195 | 238 | 329 | 244 | 189 | 297 | 108 | 141 |
| 2018 | 394 | 155 | 331 | 380 | 349 | 305 | 183 | 264 | 267 | 281 | 224 | 269 |
| 2019 | 245 | 145 | 343 | 351 | 211 | 339 | 396 | 370 | 236 | 283 | 237 | 323 |
| 2020 | 300 | 265 | 220 | 65 | 101 | 325 | 366 | 556 | 418 | 428 | 460 | 475 |
| 2021 | 234 | 261 | 422 | 374 | 427 | 343 | 320 | 286 | 279 | 311 | 232 | 226 |
| 2022 | 213 | 250 | 301 | 258 | 316 | 316 | 315 | 281 | 382 | 225 | 185 | 204 |
| 2023 | 360 | 256 | 321 | 251 | 370 | 301 | 419 | 336 | 430 | 298 | 374 | 519 |
| 2024 | 446 | 394 | 281 | 374 | ||||||||
| - = No Data Reported; -- = Not Applicable; NA = Not Available; W = Withheld to avoid disclosure of individual company data. |
| Release Date: 6/28/2024 |
| Next Release Date: 7/31/2024 |