|
Download Data (XLS File) |
|
||||||||
|
||||||||
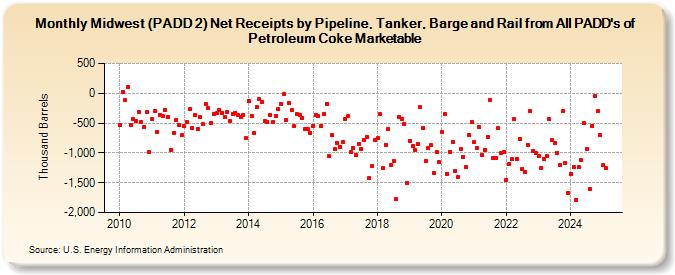
| Midwest (PADD 2) Net Receipts by Pipeline, Tanker, Barge and Rail from All PADD's of Petroleum Coke Marketable (Thousand Barrels) | ||||||||
| Year | Jan | Feb | Mar | Apr | May | Jun | Jul | Aug | Sep | Oct | Nov | Dec |
|---|---|---|---|---|---|---|---|---|---|---|---|---|
| 2010 | -539 | 27 | -117 | 99 | -526 | -434 | -462 | -306 | -484 | -559 | -317 | -986 |
| 2011 | -431 | -301 | -650 | -361 | -384 | -275 | -392 | -949 | -661 | -455 | -531 | -702 |
| 2012 | -556 | -479 | -271 | -580 | -361 | -604 | -394 | -521 | -173 | -251 | -493 | -349 |
| 2013 | -335 | -273 | -336 | -403 | -321 | -462 | -345 | -324 | -357 | -391 | -364 | -747 |
| 2014 | -123 | -387 | -670 | -234 | -102 | -142 | -469 | -478 | -365 | -479 | -382 | -266 |
| 2015 | -176 | -19 | -450 | -158 | -280 | -556 | -354 | -356 | -408 | -595 | -607 | -666 |
| 2016 | -543 | -357 | -382 | -555 | -341 | -172 | -1,049 | -705 | -937 | -836 | -895 | -820 |
| 2017 | -433 | -381 | -991 | -915 | -1,043 | -843 | -926 | -787 | -725 | -1,421 | -1,219 | -786 |
| 2018 | -755 | -354 | -1,245 | -861 | -604 | -1,205 | -1,138 | -1,769 | -397 | -423 | -509 | -1,503 |
| 2019 | -794 | -891 | -954 | -843 | -238 | -584 | -1,132 | -909 | -875 | -1,339 | -982 | -1,158 |
| 2020 | -643 | -353 | -1,350 | -977 | -823 | -1,303 | -1,402 | -941 | -1,064 | -1,236 | -691 | -474 |
| 2021 | -822 | -919 | -572 | -1,036 | -951 | -727 | -105 | -1,087 | -1,087 | -582 | -1,004 | -991 |
| 2022 | -1,449 | -1,194 | -1,110 | -433 | -1,094 | -769 | -1,266 | -1,317 | -859 | -304 | -966 | -1,008 |
| 2023 | -1,047 | -1,246 | -1,108 | -1,051 | -439 | -787 | -832 | -1,011 | -1,208 | -305 | -1,160 | -1,677 |
| 2024 | -1,368 | |||||||||||
| - = No Data Reported; -- = Not Applicable; NA = Not Available; W = Withheld to avoid disclosure of individual company data. |
| Release Date: 3/29/2024 |
| Next Release Date: 4/30/2024 |