|
Download Data (XLS File) |
|
||||||||
|
||||||||
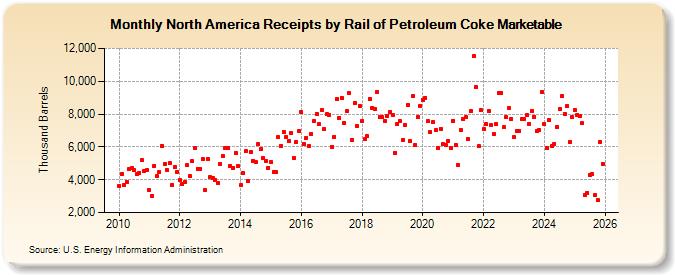
| North America Receipts by Rail of Petroleum Coke Marketable (Thousand Barrels) | ||||||||
| Year | Jan | Feb | Mar | Apr | May | Jun | Jul | Aug | Sep | Oct | Nov | Dec |
|---|---|---|---|---|---|---|---|---|---|---|---|---|
| 2010 | 3,629 | 4,348 | 3,688 | 3,855 | 4,638 | 4,685 | 4,588 | 4,342 | 4,433 | 5,198 | 4,520 | 4,590 |
| 2011 | 3,352 | 3,016 | 4,865 | 4,203 | 4,479 | 6,076 | 4,974 | 4,586 | 4,997 | 3,696 | 4,777 | 4,492 |
| 2012 | 3,989 | 3,745 | 3,887 | 4,876 | 4,201 | 5,116 | 5,903 | 4,667 | 4,623 | 5,270 | 3,346 | 5,288 |
| 2013 | 4,143 | 4,088 | 4,010 | 3,812 | 4,958 | 5,420 | 5,930 | 5,926 | 4,823 | 4,734 | 5,637 | 4,865 |
| 2014 | 3,649 | 4,395 | 5,722 | 3,907 | 5,693 | 5,156 | 5,073 | 6,147 | 5,853 | 5,335 | 5,157 | 4,737 |
| 2015 | 5,078 | 4,457 | 4,454 | 6,582 | 6,080 | 6,937 | 6,617 | 6,345 | 6,831 | 5,336 | 6,285 | 6,970 |
| 2016 | 8,113 | 6,200 | 6,561 | 6,025 | 6,798 | 7,556 | 8,023 | 7,370 | 8,242 | 7,082 | 7,989 | 7,962 |
| 2017 | 6,012 | 6,630 | 8,892 | 7,752 | 8,997 | 7,451 | 8,158 | 9,266 | 6,441 | 8,689 | 7,249 | 8,500 |
| 2018 | 7,585 | 6,463 | 6,641 | 8,924 | 8,391 | 8,336 | 9,354 | 7,827 | 7,799 | 7,577 | 7,867 | 8,142 |
| 2019 | 7,949 | 5,650 | 7,370 | 7,554 | 6,423 | 7,337 | 8,559 | 6,348 | 9,084 | 6,128 | 7,806 | 8,519 |
| 2020 | 8,877 | 8,989 | 7,559 | 6,899 | 7,491 | 7,006 | 5,951 | 7,108 | 6,200 | 6,088 | 6,372 | 5,906 |
| 2021 | 7,579 | 6,108 | 4,898 | 7,004 | 7,672 | 7,803 | 6,486 | 8,170 | 11,517 | 9,630 | 6,025 | 8,226 |
| 2022 | 7,066 | 7,387 | 8,194 | 7,305 | 6,806 | 7,382 | 9,282 | 9,299 | 7,194 | 7,799 | 8,353 | 7,725 |
| 2023 | 6,586 | 6,968 | 6,982 | 7,697 | 7,682 | 7,933 | 7,422 | 8,190 | 7,844 | 6,950 | 7,028 | 9,077 |
| 2024 | 6,982 | |||||||||||
| - = No Data Reported; -- = Not Applicable; NA = Not Available; W = Withheld to avoid disclosure of individual company data. |
| Release Date: 3/29/2024 |
| Next Release Date: 4/30/2024 |
Referring Pages: