|
Download Data (XLS File) |
|
||||||||
|
||||||||
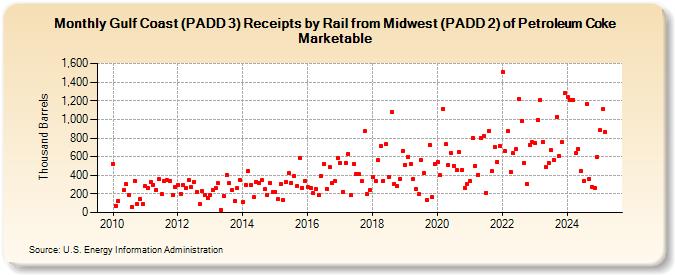
| Gulf Coast (PADD 3) Receipts by Rail from Midwest (PADD 2) of Petroleum Coke Marketable (Thousand Barrels) | ||||||||
| Year | Jan | Feb | Mar | Apr | May | Jun | Jul | Aug | Sep | Oct | Nov | Dec |
|---|---|---|---|---|---|---|---|---|---|---|---|---|
| 2010 | 524 | 75 | 127 | 241 | 306 | 190 | 63 | 340 | 88 | 146 | 93 | |
| 2011 | 282 | 259 | 327 | 300 | 247 | 356 | 199 | 339 | 349 | 342 | 185 | 273 |
| 2012 | 301 | 202 | 296 | 268 | 349 | 273 | 328 | 224 | 89 | 231 | 184 | 152 |
| 2013 | 191 | 247 | 263 | 312 | 23 | 173 | 405 | 315 | 244 | 121 | 263 | 354 |
| 2014 | 114 | 296 | 445 | 301 | 163 | 331 | 321 | 352 | 250 | 193 | 320 | 221 |
| 2015 | 226 | 141 | 305 | 130 | 333 | 421 | 318 | 392 | 280 | 588 | 265 | 343 |
| 2016 | 274 | 260 | 206 | 255 | 185 | 388 | 525 | 253 | 486 | 313 | 338 | 585 |
| 2017 | 535 | 224 | 532 | 633 | 186 | 523 | 409 | 409 | 335 | 872 | 194 | 242 |
| 2018 | 380 | 340 | 561 | 710 | 344 | 735 | 384 | 1,077 | 306 | 280 | 363 | 659 |
| 2019 | 515 | 600 | 523 | 361 | 248 | 195 | 561 | 422 | 134 | 726 | 162 | 524 |
| 2020 | 541 | 398 | 1,116 | 732 | 509 | 641 | 504 | 456 | 646 | 461 | 264 | 303 |
| 2021 | 335 | 798 | 500 | 406 | 802 | 826 | 213 | 876 | 441 | 706 | 546 | 719 |
| 2022 | 1,510 | 659 | 870 | 435 | 634 | 678 | 1,217 | 983 | 535 | 310 | 730 | 754 |
| 2023 | 747 | 993 | 1,213 | 760 | 488 | 535 | 670 | 568 | 1,030 | 609 | 762 | 1,286 |
| 2024 | 1,232 | |||||||||||
| - = No Data Reported; -- = Not Applicable; NA = Not Available; W = Withheld to avoid disclosure of individual company data. |
| Release Date: 3/29/2024 |
| Next Release Date: 4/30/2024 |