|
Download Data (XLS File) |
|
||||||||
|
||||||||
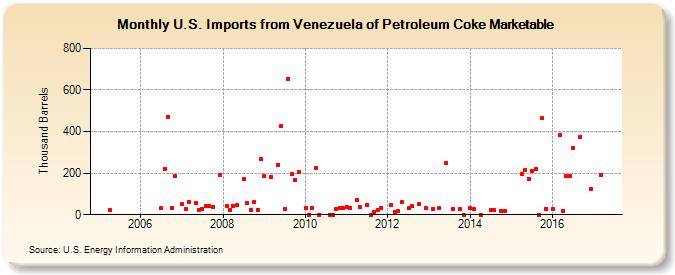
| U.S. Imports from Venezuela of Petroleum Coke Marketable (Thousand Barrels) | ||||||||
| Year | Jan | Feb | Mar | Apr | May | Jun | Jul | Aug | Sep | Oct | Nov | Dec |
|---|---|---|---|---|---|---|---|---|---|---|---|---|
| 2005 | 25 | |||||||||||
| 2006 | 30 | 222 | 469 | 34 | 185 | |||||||
| 2007 | 50 | 27 | 63 | 54 | 23 | 27 | 43 | 40 | 38 | 190 | ||
| 2008 | 42 | 25 | 42 | 45 | 171 | 56 | 25 | 60 | 25 | 268 | ||
| 2009 | 185 | 183 | 241 | 427 | 29 | 654 | 194 | 168 | 205 | |||
| 2010 | 32 | 1 | 34 | 226 | 1 | 1 | 1 | 29 | 33 | 31 | ||
| 2011 | 35 | 32 | 73 | 36 | 46 | 1 | 15 | 25 | 31 | |||
| 2012 | 47 | 15 | 18 | 60 | 30 | 44 | 50 | 31 | ||||
| 2013 | 29 | 30 | 250 | 26 | 26 | 1 | ||||||
| 2014 | 31 | 26 | 1 | 22 | 21 | 17 | 20 | |||||
| 2015 | 195 | 213 | 173 | 212 | 221 | 1 | 463 | 29 | ||||
| 2016 | 28 | 384 | 18 | 187 | 185 | 322 | 375 | 125 | ||||
| 2017 | 192 | |||||||||||
| - = No Data Reported; -- = Not Applicable; NA = Not Available; W = Withheld to avoid disclosure of individual company data. |
| Release Date: 6/28/2024 |
| Next Release Date: 7/31/2024 |