|
Download Data (XLS File) |
|
||||||||
|
||||||||
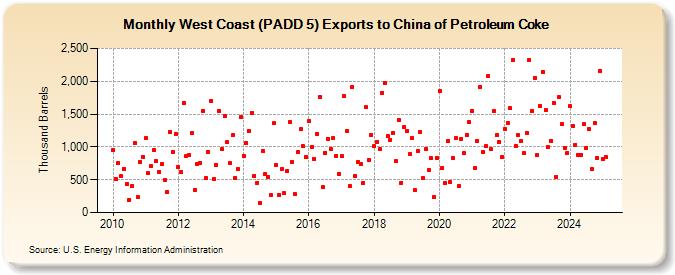
| West Coast (PADD 5) Exports to China of Petroleum Coke (Thousand Barrels) | ||||||||
| Year | Jan | Feb | Mar | Apr | May | Jun | Jul | Aug | Sep | Oct | Nov | Dec |
|---|---|---|---|---|---|---|---|---|---|---|---|---|
| 2010 | 953 | 515 | 756 | 553 | 668 | 435 | 197 | 409 | 1,062 | 235 | 777 | 847 |
| 2011 | 1,137 | 602 | 707 | 953 | 781 | 622 | 741 | 501 | 312 | 1,231 | 928 | 1,198 |
| 2012 | 697 | 619 | 1,669 | 857 | 880 | 1,218 | 344 | 739 | 758 | 1,552 | 530 | 926 |
| 2013 | 1,706 | 507 | 729 | 1,544 | 966 | 1,474 | 1,070 | 751 | 1,177 | 527 | 667 | 1,448 |
| 2014 | 866 | 1,057 | 1,244 | 1,521 | 561 | 451 | 153 | 933 | 587 | 546 | 274 | 1,357 |
| 2015 | 728 | 270 | 667 | 292 | 631 | 1,378 | 773 | 282 | 922 | 1,268 | 1,008 | 853 |
| 2016 | 1,393 | 995 | 820 | 1,199 | 1,758 | 387 | 909 | 1,124 | 964 | 1,130 | 868 | 592 |
| 2017 | 855 | 1,768 | 1,244 | 401 | 1,911 | 556 | 770 | 734 | 455 | 1,600 | 802 | 1,184 |
| 2018 | 1,006 | 1,076 | 966 | 1,824 | 1,980 | 1,171 | 1,106 | 1,216 | 781 | 1,416 | 457 | 1,299 |
| 2019 | 1,246 | 888 | 1,137 | 343 | 937 | 1,232 | 529 | 965 | 648 | 826 | 238 | 837 |
| 2020 | 1,847 | 684 | 452 | 1,094 | 458 | 825 | 1,133 | 402 | 1,124 | 910 | 1,183 | 1,376 |
| 2021 | 1,543 | 686 | 1,094 | 1,917 | 918 | 1,013 | 2,079 | 963 | 1,543 | 1,178 | 1,077 | 843 |
| 2022 | 1,279 | 1,363 | 1,587 | 2,325 | 1,017 | 1,176 | 1,087 | 906 | 1,215 | 2,319 | 1,545 | 2,055 |
| 2023 | 825 | 1,900 | 1,986 | 1,854 | 557 | 983 | 1,763 | 548 | 1,757 | 1,345 | 990 | 1,120 |
| 2024 | 1,616 | 1,313 | 1,033 | 877 | ||||||||
| - = No Data Reported; -- = Not Applicable; NA = Not Available; W = Withheld to avoid disclosure of individual company data. |
| Release Date: 6/28/2024 |
| Next Release Date: 7/31/2024 |