|
Download Data (XLS File) |
|
||||||||
|
||||||||
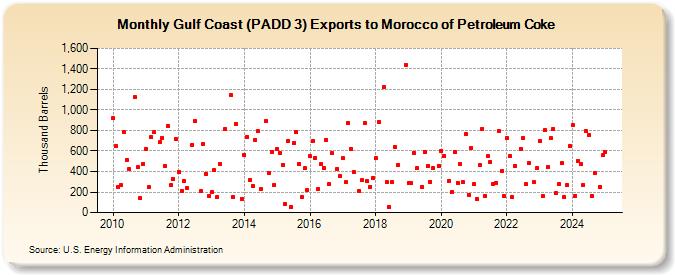
| Gulf Coast (PADD 3) Exports to Morocco of Petroleum Coke (Thousand Barrels) | ||||||||
| Year | Jan | Feb | Mar | Apr | May | Jun | Jul | Aug | Sep | Oct | Nov | Dec |
|---|---|---|---|---|---|---|---|---|---|---|---|---|
| 2010 | 917 | 644 | 248 | 264 | 784 | 515 | 422 | 1,123 | 440 | 138 | 477 | |
| 2011 | 621 | 248 | 737 | 785 | 684 | 727 | 450 | 846 | 266 | 326 | 716 | |
| 2012 | 399 | 211 | 306 | 240 | 660 | 893 | 207 | 668 | 380 | 165 | ||
| 2013 | 196 | 411 | 148 | 472 | 816 | 1,144 | 148 | 860 | 135 | |||
| 2014 | 560 | 735 | 317 | 263 | 712 | 791 | 226 | 892 | 386 | 594 | 270 | |
| 2015 | 624 | 582 | 468 | 83 | 700 | 55 | 674 | 782 | 475 | 151 | 430 | 216 |
| 2016 | 547 | 693 | 534 | 229 | 469 | 432 | 711 | 276 | 582 | 428 | 357 | |
| 2017 | 531 | 294 | 874 | 622 | 394 | 212 | 313 | 876 | 303 | 252 | 340 | |
| 2018 | 529 | 885 | 1,220 | 293 | 55 | 294 | 641 | 462 | 1,442 | |||
| 2019 | 290 | 284 | 583 | 431 | 253 | 594 | 454 | 302 | 433 | 457 | ||
| 2020 | 599 | 549 | 309 | 199 | 590 | 289 | 470 | 293 | 763 | 175 | 627 | |
| 2021 | 275 | 134 | 459 | 818 | 166 | 548 | 494 | 278 | 289 | 797 | 401 | 158 |
| 2022 | 722 | 550 | 151 | 454 | 620 | 725 | 277 | 479 | 295 | 431 | ||
| 2023 | 696 | 438 | 507 | 444 | 723 | 818 | 187 | 275 | 482 | 151 | 269 | 649 |
| 2024 | 852 | |||||||||||
| - = No Data Reported; -- = Not Applicable; NA = Not Available; W = Withheld to avoid disclosure of individual company data. |
| Release Date: 3/29/2024 |
| Next Release Date: 4/30/2024 |