|
Download Data (XLS File) |
|
||||||||
|
||||||||
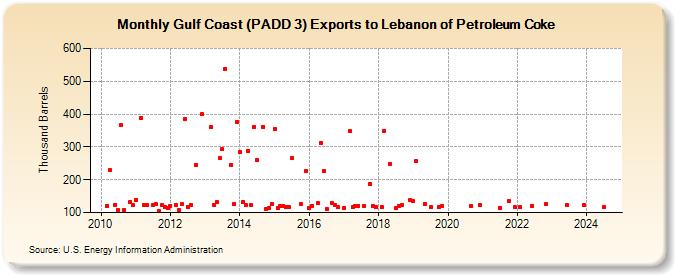
| Gulf Coast (PADD 3) Exports to Lebanon of Petroleum Coke (Thousand Barrels) | ||||||||
| Year | Jan | Feb | Mar | Apr | May | Jun | Jul | Aug | Sep | Oct | Nov | Dec |
|---|---|---|---|---|---|---|---|---|---|---|---|---|
| 2010 | 121 | 229 | 124 | 107 | 366 | 108 | 132 | 122 | ||||
| 2011 | 138 | 388 | 122 | 123 | 123 | 126 | 104 | 123 | 116 | 113 | ||
| 2012 | 121 | 123 | 108 | 125 | 386 | 117 | 122 | 245 | 399 | |||
| 2013 | 360 | 124 | 132 | 265 | 293 | 538 | 246 | 127 | 377 | |||
| 2014 | 285 | 133 | 123 | 287 | 123 | 360 | 260 | 362 | 111 | 114 | 127 | |
| 2015 | 353 | 113 | 121 | 121 | 117 | 116 | 267 | 125 | 227 | |||
| 2016 | 115 | 121 | 128 | 312 | 228 | 112 | 129 | 122 | 116 | |||
| 2017 | 115 | 347 | 116 | 120 | 121 | 121 | 188 | 121 | 116 | |||
| 2018 | 117 | 349 | 248 | 114 | 119 | 124 | 137 | |||||
| 2019 | 134 | 256 | 127 | 116 | 118 | 120 | ||||||
| 2020 | 121 | 123 | ||||||||||
| 2021 | 114 | 134 | 117 | |||||||||
| 2022 | 116 | 121 | 126 | |||||||||
| 2023 | 123 | 123 | ||||||||||
| - = No Data Reported; -- = Not Applicable; NA = Not Available; W = Withheld to avoid disclosure of individual company data. |
| Release Date: 3/29/2024 |
| Next Release Date: 4/30/2024 |