|
Download Data (XLS File) |
|
||||||||
|
||||||||
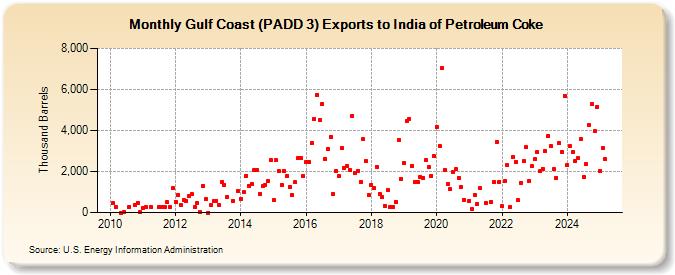
| Gulf Coast (PADD 3) Exports to India of Petroleum Coke (Thousand Barrels) | ||||||||
| Year | Jan | Feb | Mar | Apr | May | Jun | Jul | Aug | Sep | Oct | Nov | Dec |
|---|---|---|---|---|---|---|---|---|---|---|---|---|
| 2010 | 465 | 272 | 0 | 5 | 274 | 373 | 484 | 3 | ||||
| 2011 | 242 | 248 | 272 | 265 | 275 | 249 | 493 | 272 | 1,174 | |||
| 2012 | 531 | 879 | 376 | 616 | 574 | 801 | 900 | 291 | 472 | 3 | 1,314 | 640 |
| 2013 | 0 | 364 | 551 | 578 | 392 | 1,479 | 1,344 | 776 | 568 | 1,044 | ||
| 2014 | 674 | 1,004 | 1,794 | 1,310 | 1,388 | 2,086 | 2,064 | 927 | 1,281 | 1,360 | 1,546 | 2,553 |
| 2015 | 624 | 2,542 | 2,013 | 1,354 | 2,028 | 1,786 | 1,251 | 856 | 1,474 | 2,646 | 2,637 | 1,793 |
| 2016 | 2,449 | 2,466 | 3,387 | 4,560 | 5,742 | 4,498 | 5,301 | 2,613 | 3,085 | 3,696 | 902 | 2,004 |
| 2017 | 1,781 | 3,139 | 2,192 | 2,262 | 2,077 | 4,713 | 1,906 | 2,040 | 1,511 | 3,566 | 2,512 | 843 |
| 2018 | 1,367 | 1,179 | 2,238 | 907 | 757 | 343 | 1,086 | 281 | 281 | 530 | 3,535 | 1,652 |
| 2019 | 2,416 | 4,484 | 4,560 | 2,264 | 1,500 | 1,509 | 1,744 | 1,698 | 2,542 | 2,198 | 1,802 | 2,768 |
| 2020 | 4,171 | 3,254 | 7,049 | 2,087 | 1,384 | 1,131 | 1,955 | 2,109 | 1,688 | 1,252 | 628 | |
| 2021 | 582 | 150 | 871 | 440 | 1,180 | 468 | 531 | 1,481 | 3,453 | 1,506 | ||
| 2022 | 298 | 1,523 | 2,300 | 272 | 2,703 | 2,471 | 588 | 1,464 | 2,502 | 3,181 | 1,531 | 2,274 |
| 2023 | 2,588 | 2,931 | 2,004 | 2,391 | 2,735 | 3,712 | 3,253 | 2,110 | 1,740 | 3,380 | 2,966 | 5,698 |
| 2024 | 2,297 | |||||||||||
| - = No Data Reported; -- = Not Applicable; NA = Not Available; W = Withheld to avoid disclosure of individual company data. |
| Release Date: 3/29/2024 |
| Next Release Date: 4/30/2024 |