|
Download Data (XLS File) |
|
||||||||
|
||||||||
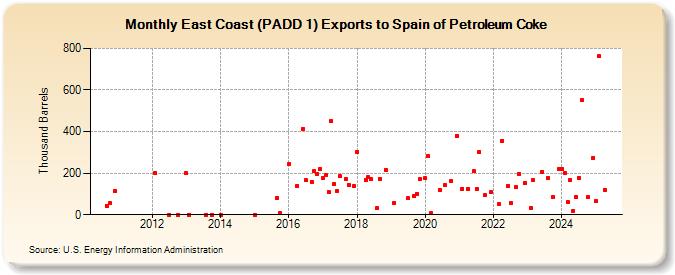
| East Coast (PADD 1) Exports to Spain of Petroleum Coke (Thousand Barrels) | ||||||||
| Year | Jan | Feb | Mar | Apr | May | Jun | Jul | Aug | Sep | Oct | Nov | Dec |
|---|---|---|---|---|---|---|---|---|---|---|---|---|
| 2010 | 44 | 54 | 115 | |||||||||
| 2012 | 201 | 1 | 0 | |||||||||
| 2013 | 199 | 0 | 0 | 0 | ||||||||
| 2014 | 0 | |||||||||||
| 2015 | 0 | 82 | 6 | |||||||||
| 2016 | 242 | 138 | 414 | 165 | 159 | 208 | 195 | 220 | ||||
| 2017 | 178 | 193 | 110 | 450 | 148 | 116 | 184 | 171 | 145 | 138 | ||
| 2018 | 304 | 169 | 181 | 170 | 32 | 173 | 217 | |||||
| 2019 | 58 | 78 | 91 | 102 | 170 | |||||||
| 2020 | 175 | 281 | 6 | 120 | 141 | 160 | 380 | |||||
| 2021 | 126 | 126 | 208 | 126 | 302 | 94 | 108 | |||||
| 2022 | 50 | 356 | 140 | 54 | 132 | 196 | 152 | |||||
| 2023 | 34 | 165 | 206 | 177 | 83 | 220 | ||||||
| 2024 | 220 | 203 | 60 | 165 | 20 | 84 | ||||||
| - = No Data Reported; -- = Not Applicable; NA = Not Available; W = Withheld to avoid disclosure of individual company data. |
| Release Date: 8/30/2024 |
| Next Release Date: 9/30/2024 |