|
Download Data (XLS File) |
|
||||||||
|
||||||||
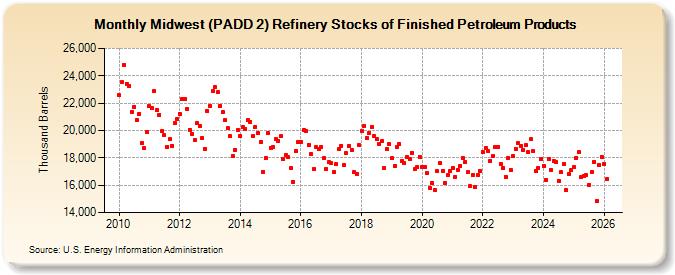
| Midwest (PADD 2) Refinery Stocks of Finished Petroleum Products (Thousand Barrels) | ||||||||
| Year | Jan | Feb | Mar | Apr | May | Jun | Jul | Aug | Sep | Oct | Nov | Dec |
|---|---|---|---|---|---|---|---|---|---|---|---|---|
| 2010 | 22,561 | 23,525 | 24,811 | 23,422 | 23,273 | 21,370 | 21,739 | 20,771 | 21,228 | 19,093 | 18,694 | 19,900 |
| 2011 | 21,755 | 21,620 | 22,855 | 21,493 | 21,146 | 19,944 | 19,669 | 18,826 | 19,367 | 18,889 | 20,549 | 20,872 |
| 2012 | 21,210 | 22,327 | 22,286 | 21,601 | 20,071 | 19,772 | 19,318 | 20,513 | 20,305 | 19,433 | 18,675 | 21,438 |
| 2013 | 21,809 | 22,858 | 23,159 | 22,780 | 21,811 | 21,326 | 20,754 | 20,156 | 19,575 | 18,152 | 18,600 | 20,041 |
| 2014 | 19,580 | 20,246 | 20,125 | 20,745 | 20,643 | 19,572 | 20,258 | 19,809 | 19,145 | 16,968 | 17,996 | 19,818 |
| 2015 | 18,745 | 18,810 | 19,356 | 19,250 | 19,576 | 17,880 | 18,221 | 18,034 | 17,256 | 16,256 | 18,492 | 19,156 |
| 2016 | 19,177 | 20,039 | 19,944 | 18,965 | 18,294 | 17,177 | 18,764 | 18,627 | 18,808 | 17,987 | 17,201 | 17,668 |
| 2017 | 17,604 | 16,959 | 17,537 | 18,635 | 18,895 | 17,486 | 18,327 | 18,863 | 18,598 | 16,941 | 16,795 | 18,940 |
| 2018 | 19,986 | 20,311 | 19,434 | 19,815 | 20,262 | 19,594 | 19,362 | 19,008 | 19,221 | 17,273 | 18,651 | 18,979 |
| 2019 | 17,957 | 17,421 | 18,801 | 19,017 | 17,781 | 17,604 | 18,043 | 17,946 | 18,387 | 17,182 | 17,298 | 18,074 |
| 2020 | 17,311 | 17,357 | 16,893 | 15,813 | 16,143 | 15,682 | 17,008 | 17,595 | 17,061 | 16,194 | 16,753 | 17,049 |
| 2021 | 17,276 | 16,625 | 17,139 | 17,398 | 17,971 | 17,687 | 16,940 | 15,910 | 16,753 | 15,856 | 16,753 | 17,035 |
| 2022 | 18,406 | 18,732 | 18,534 | 17,791 | 18,116 | 18,802 | 18,811 | 17,564 | 17,277 | 16,601 | 18,000 | 17,096 |
| 2023 | 18,116 | 18,659 | 19,066 | 18,901 | 18,573 | 18,907 | 18,396 | 19,356 | 18,470 | 17,037 | 17,286 | 17,952 |
| 2024 | 17,410 | |||||||||||
| - = No Data Reported; -- = Not Applicable; NA = Not Available; W = Withheld to avoid disclosure of individual company data. |
| Release Date: 3/29/2024 |
| Next Release Date: 4/30/2024 |