|
Download Data (XLS File) |
|
||||||||
|
||||||||
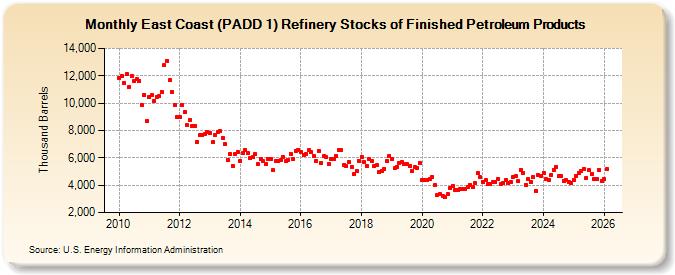
| East Coast (PADD 1) Refinery Stocks of Finished Petroleum Products (Thousand Barrels) | ||||||||
| Year | Jan | Feb | Mar | Apr | May | Jun | Jul | Aug | Sep | Oct | Nov | Dec |
|---|---|---|---|---|---|---|---|---|---|---|---|---|
| 2010 | 11,843 | 12,014 | 11,498 | 12,117 | 11,186 | 11,967 | 11,613 | 11,741 | 11,637 | 9,875 | 10,583 | 8,692 |
| 2011 | 10,425 | 10,590 | 10,187 | 10,477 | 10,511 | 10,817 | 12,762 | 13,107 | 11,689 | 10,796 | 9,852 | 8,995 |
| 2012 | 8,975 | 9,895 | 9,318 | 8,386 | 8,778 | 8,306 | 8,358 | 7,186 | 7,640 | 7,690 | 7,745 | 7,858 |
| 2013 | 7,798 | 7,156 | 7,677 | 7,868 | 7,929 | 7,450 | 6,988 | 5,850 | 6,268 | 5,438 | 6,312 | 6,437 |
| 2014 | 5,796 | 6,343 | 6,606 | 6,385 | 5,970 | 6,051 | 6,270 | 5,541 | 5,916 | 5,770 | 5,513 | 5,908 |
| 2015 | 5,941 | 5,088 | 5,798 | 5,778 | 5,827 | 6,070 | 5,757 | 5,849 | 6,273 | 5,899 | 6,511 | 6,593 |
| 2016 | 6,439 | 6,223 | 6,290 | 6,554 | 6,418 | 6,161 | 5,782 | 6,520 | 5,657 | 6,110 | 6,040 | 5,579 |
| 2017 | 5,928 | 5,939 | 6,137 | 6,585 | 6,542 | 5,500 | 5,380 | 5,702 | 5,353 | 4,788 | 5,032 | 5,793 |
| 2018 | 6,077 | 5,694 | 5,413 | 5,894 | 5,799 | 5,395 | 5,463 | 4,938 | 5,039 | 5,218 | 5,789 | 6,117 |
| 2019 | 5,897 | 5,227 | 5,363 | 5,635 | 5,712 | 5,583 | 5,539 | 5,419 | 5,043 | 5,294 | 5,230 | 5,655 |
| 2020 | 4,369 | 4,377 | 4,354 | 4,480 | 4,610 | 3,989 | 3,291 | 3,327 | 3,203 | 3,120 | 3,366 | 3,784 |
| 2021 | 3,971 | 3,671 | 3,676 | 3,721 | 3,709 | 3,751 | 3,837 | 4,046 | 3,844 | 4,159 | 4,857 | 4,572 |
| 2022 | 4,255 | 4,358 | 4,078 | 4,110 | 4,229 | 4,204 | 4,465 | 4,078 | 4,132 | 4,377 | 4,196 | 4,270 |
| 2023 | 4,617 | 4,647 | 4,270 | 5,116 | 4,904 | 4,036 | 4,423 | 4,241 | 4,610 | 3,584 | 4,735 | 4,690 |
| 2024 | 4,918 | |||||||||||
| - = No Data Reported; -- = Not Applicable; NA = Not Available; W = Withheld to avoid disclosure of individual company data. |
| Release Date: 3/29/2024 |
| Next Release Date: 4/30/2024 |