|
Download Data (XLS File) |
|
||||||||
|
||||||||
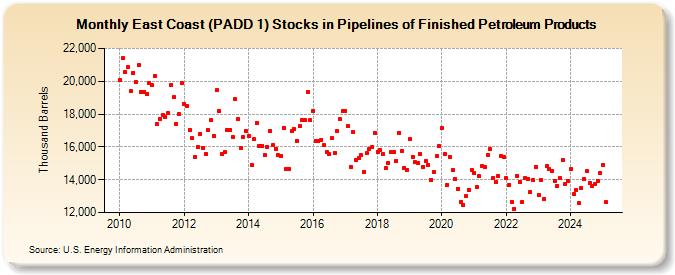
| East Coast (PADD 1) Stocks in Pipelines of Finished Petroleum Products (Thousand Barrels) | ||||||||
| Year | Jan | Feb | Mar | Apr | May | Jun | Jul | Aug | Sep | Oct | Nov | Dec |
|---|---|---|---|---|---|---|---|---|---|---|---|---|
| 2010 | 20,050 | 21,399 | 20,567 | 20,844 | 19,383 | 20,524 | 19,941 | 20,969 | 19,367 | 19,348 | 19,242 | 19,882 |
| 2011 | 19,740 | 20,342 | 17,386 | 17,710 | 17,955 | 17,807 | 18,090 | 19,756 | 19,025 | 17,395 | 17,998 | 19,882 |
| 2012 | 18,611 | 18,465 | 17,027 | 16,529 | 15,402 | 16,017 | 16,796 | 15,912 | 15,584 | 17,009 | 17,608 | 16,682 |
| 2013 | 19,458 | 18,200 | 15,596 | 15,687 | 17,000 | 17,057 | 16,606 | 18,898 | 17,696 | 15,931 | 16,593 | 16,949 |
| 2014 | 16,673 | 14,917 | 16,458 | 17,477 | 16,054 | 16,074 | 15,482 | 16,016 | 16,976 | 16,100 | 15,894 | 15,486 |
| 2015 | 15,420 | 17,172 | 14,659 | 14,671 | 16,964 | 17,088 | 16,377 | 17,243 | 17,641 | 17,619 | 19,355 | 17,636 |
| 2016 | 18,213 | 16,383 | 16,329 | 16,441 | 16,085 | 15,700 | 15,540 | 16,520 | 15,655 | 16,938 | 17,675 | 18,167 |
| 2017 | 18,192 | 17,267 | 14,796 | 16,877 | 15,209 | 15,323 | 15,481 | 14,500 | 15,601 | 15,897 | 16,002 | 16,875 |
| 2018 | 15,678 | 15,820 | 15,576 | 14,697 | 15,039 | 15,667 | 15,688 | 15,162 | 16,854 | 15,761 | 14,727 | 14,599 |
| 2019 | 16,476 | 15,403 | 15,064 | 15,037 | 15,588 | 14,795 | 15,151 | 14,907 | 14,000 | 14,472 | 15,421 | 16,024 |
| 2020 | 17,164 | 15,559 | 13,685 | 15,386 | 14,615 | 14,036 | 13,455 | 12,635 | 12,475 | 12,986 | 13,401 | 14,600 |
| 2021 | 14,415 | 13,560 | 14,210 | 14,829 | 14,760 | 15,509 | 15,877 | 14,081 | 13,840 | 14,235 | 15,457 | 15,397 |
| 2022 | 14,077 | 13,706 | 12,670 | 12,232 | 14,247 | 13,888 | 12,668 | 14,081 | 14,053 | 13,261 | 13,980 | 14,790 |
| 2023 | 13,053 | 13,974 | 12,705 | 14,807 | 14,636 | 14,507 | 13,934 | 13,620 | 14,075 | 15,174 | 13,733 | 13,896 |
| 2024 | 14,630 | |||||||||||
| - = No Data Reported; -- = Not Applicable; NA = Not Available; W = Withheld to avoid disclosure of individual company data. |
| Release Date: 3/29/2024 |
| Next Release Date: 4/30/2024 |