|
Download Data (XLS File) |
|
||||||||
|
||||||||
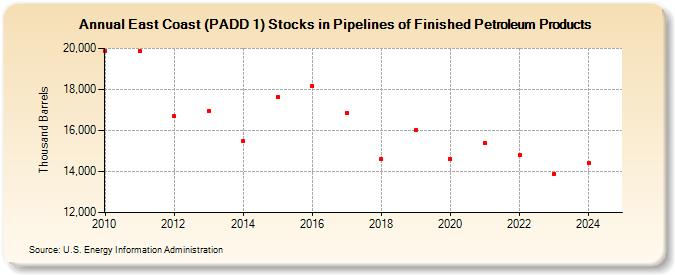
| East Coast (PADD 1) Stocks in Pipelines of Finished Petroleum Products (Thousand Barrels) | ||||||||
| Decade | Year-0 | Year-1 | Year-2 | Year-3 | Year-4 | Year-5 | Year-6 | Year-7 | Year-8 | Year-9 |
|---|---|---|---|---|---|---|---|---|---|---|
| 2010's | 19,882 | 19,882 | 16,682 | 16,949 | 15,486 | 17,636 | 18,167 | 16,875 | 14,599 | 16,024 |
| 2020's | 14,600 | 15,397 | 14,790 | 13,897 | 14,425 |
| - = No Data Reported; -- = Not Applicable; NA = Not Available; W = Withheld to avoid disclosure of individual company data. |
| Release Date: 6/30/2025 |
| Next Release Date: 8/29/2025 |