|
Download Data (XLS File) |
|
||||||||
|
||||||||
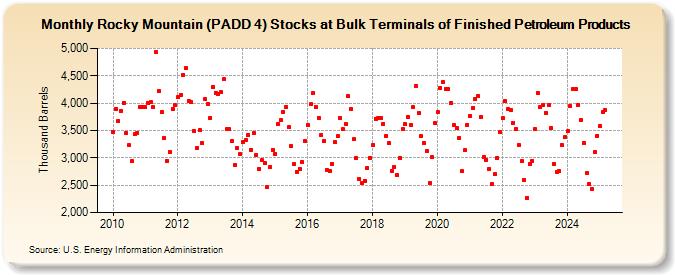
| Rocky Mountain (PADD 4) Stocks at Bulk Terminals of Finished Petroleum Products (Thousand Barrels) | ||||||||
| Year | Jan | Feb | Mar | Apr | May | Jun | Jul | Aug | Sep | Oct | Nov | Dec |
|---|---|---|---|---|---|---|---|---|---|---|---|---|
| 2010 | 3,477 | 3,896 | 3,680 | 3,852 | 4,004 | 3,455 | 3,229 | 2,936 | 3,431 | 3,458 | 3,928 | 3,932 |
| 2011 | 3,923 | 4,004 | 4,018 | 3,923 | 4,925 | 4,214 | 3,838 | 3,363 | 2,951 | 3,115 | 3,890 | 3,962 |
| 2012 | 4,103 | 4,150 | 4,521 | 4,638 | 4,045 | 4,012 | 3,496 | 3,182 | 3,502 | 3,271 | 4,068 | 3,976 |
| 2013 | 3,730 | 4,301 | 4,192 | 4,173 | 4,205 | 4,434 | 3,520 | 3,519 | 3,304 | 2,866 | 3,176 | 3,066 |
| 2014 | 3,286 | 3,327 | 3,418 | 3,148 | 3,451 | 3,052 | 2,801 | 2,952 | 2,899 | 2,458 | 2,831 | 3,152 |
| 2015 | 3,073 | 3,618 | 3,688 | 3,836 | 3,933 | 3,555 | 3,209 | 2,880 | 2,750 | 2,802 | 2,921 | 3,312 |
| 2016 | 3,602 | 3,978 | 4,176 | 3,932 | 3,735 | 3,415 | 3,309 | 2,780 | 2,768 | 2,893 | 3,287 | 3,391 |
| 2017 | 3,732 | 3,522 | 3,625 | 4,121 | 3,889 | 3,338 | 3,001 | 2,622 | 2,536 | 2,581 | 2,818 | 3,000 |
| 2018 | 3,234 | 3,717 | 3,720 | 3,725 | 3,627 | 3,407 | 3,264 | 2,766 | 2,835 | 2,682 | 2,999 | 3,519 |
| 2019 | 3,611 | 3,746 | 3,608 | 3,922 | 4,317 | 3,817 | 3,394 | 3,269 | 3,132 | 2,542 | 3,015 | 3,633 |
| 2020 | 3,836 | 4,282 | 4,379 | 4,258 | 4,254 | 4,003 | 3,593 | 3,546 | 3,364 | 2,752 | 3,137 | 3,605 |
| 2021 | 3,765 | 3,911 | 4,070 | 4,130 | 3,742 | 3,019 | 2,967 | 2,801 | 2,518 | 2,700 | 3,006 | 3,472 |
| 2022 | 3,722 | 4,033 | 3,893 | 3,876 | 3,644 | 3,529 | 3,239 | 2,940 | 2,602 | 2,272 | 2,879 | 2,944 |
| 2023 | 3,526 | 4,182 | 3,920 | 3,973 | 3,825 | 3,960 | 3,549 | 2,896 | 2,747 | 2,752 | 3,227 | 3,372 |
| 2024 | 3,483 | 3,949 | 4,259 | 4,267 | 3,962 | 3,696 | 3,274 | 2,717 | 2,525 | 2,436 | 3,102 | 3,407 |
| 2025 | 3,579 | 3,830 | 3,872 | 3,797 | ||||||||
| - = No Data Reported; -- = Not Applicable; NA = Not Available; W = Withheld to avoid disclosure of individual company data. |
| Release Date: 6/30/2025 |
| Next Release Date: 7/31/2025 |