|
Download Data (XLS File) |
|
||||||||
|
||||||||
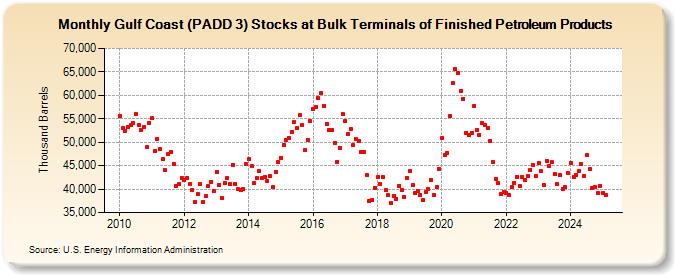
| Gulf Coast (PADD 3) Stocks at Bulk Terminals of Finished Petroleum Products (Thousand Barrels) | ||||||||
| Year | Jan | Feb | Mar | Apr | May | Jun | Jul | Aug | Sep | Oct | Nov | Dec |
|---|---|---|---|---|---|---|---|---|---|---|---|---|
| 2010 | 55,599 | 52,984 | 52,408 | 53,244 | 53,637 | 54,169 | 55,993 | 53,599 | 52,666 | 53,261 | 48,887 | 54,152 |
| 2011 | 55,119 | 48,161 | 50,733 | 48,447 | 46,326 | 43,991 | 47,408 | 47,981 | 45,445 | 40,671 | 41,102 | 42,332 |
| 2012 | 41,954 | 42,412 | 41,075 | 39,847 | 37,191 | 38,922 | 41,005 | 37,281 | 38,439 | 40,618 | 41,620 | 39,538 |
| 2013 | 43,698 | 40,972 | 38,210 | 41,277 | 42,329 | 41,042 | 45,049 | 41,163 | 39,920 | 39,716 | 40,011 | 45,314 |
| 2014 | 46,359 | 44,965 | 41,228 | 42,281 | 43,760 | 42,432 | 42,568 | 41,708 | 42,741 | 40,374 | 43,673 | 45,762 |
| 2015 | 46,724 | 49,409 | 50,435 | 50,905 | 52,132 | 54,303 | 52,996 | 55,695 | 53,658 | 48,325 | 50,573 | 54,439 |
| 2016 | 57,021 | 57,474 | 59,325 | 60,402 | 57,744 | 53,955 | 52,534 | 52,645 | 49,761 | 45,833 | 48,867 | 55,916 |
| 2017 | 54,459 | 51,761 | 52,765 | 49,379 | 50,643 | 50,347 | 47,935 | 47,931 | 43,019 | 37,382 | 37,690 | 40,321 |
| 2018 | 42,555 | 41,132 | 42,619 | 39,786 | 38,656 | 37,117 | 38,627 | 37,903 | 40,724 | 39,817 | 38,420 | 42,472 |
| 2019 | 43,897 | 40,890 | 39,080 | 39,644 | 38,719 | 37,734 | 39,402 | 39,979 | 41,918 | 38,827 | 40,433 | 44,361 |
| 2020 | 50,829 | 47,204 | 47,746 | 55,559 | 62,569 | 65,647 | 64,722 | 61,013 | 59,288 | 52,043 | 51,514 | 52,045 |
| 2021 | 57,797 | 52,496 | 51,633 | 54,109 | 53,616 | 52,996 | 50,331 | 45,874 | 42,157 | 41,226 | 38,855 | 39,478 |
| 2022 | 39,201 | 38,683 | 40,351 | 41,398 | 42,591 | 40,652 | 42,550 | 41,858 | 42,726 | 44,113 | 45,135 | 42,852 |
| 2023 | 45,725 | 43,774 | 40,893 | 45,932 | 44,996 | 45,775 | 43,145 | 40,459 | 42,325 | 39,981 | 40,403 | 43,454 |
| 2024 | 45,666 | |||||||||||
| - = No Data Reported; -- = Not Applicable; NA = Not Available; W = Withheld to avoid disclosure of individual company data. |
| Release Date: 3/29/2024 |
| Next Release Date: 4/30/2024 |