|
Download Data (XLS File) |
|
||||||||
|
||||||||
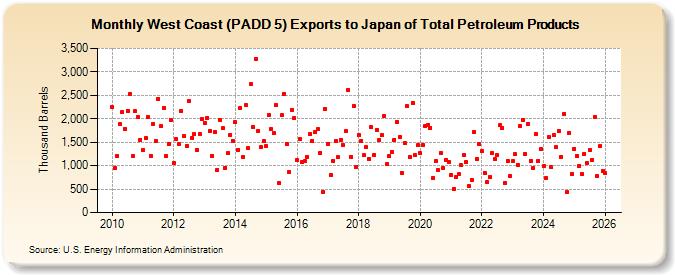
| West Coast (PADD 5) Exports to Japan of Total Petroleum Products (Thousand Barrels) | ||||||||
| Year | Jan | Feb | Mar | Apr | May | Jun | Jul | Aug | Sep | Oct | Nov | Dec |
|---|---|---|---|---|---|---|---|---|---|---|---|---|
| 2010 | 2,244 | 959 | 1,214 | 1,880 | 2,136 | 1,788 | 2,172 | 2,527 | 1,200 | 2,156 | 2,035 | 1,547 |
| 2011 | 1,339 | 1,587 | 2,042 | 1,206 | 1,897 | 1,536 | 2,429 | 1,845 | 2,237 | 1,200 | 1,454 | 1,983 |
| 2012 | 1,056 | 1,561 | 1,455 | 2,173 | 1,625 | 1,422 | 2,370 | 1,599 | 1,668 | 1,335 | 1,678 | 1,999 |
| 2013 | 1,917 | 2,017 | 1,743 | 1,215 | 1,708 | 909 | 1,974 | 1,794 | 960 | 1,266 | 1,661 | 1,536 |
| 2014 | 1,930 | 1,344 | 2,231 | 1,188 | 2,286 | 1,368 | 2,733 | 1,831 | 3,282 | 1,749 | 1,393 | 1,519 |
| 2015 | 1,409 | 2,079 | 1,777 | 1,696 | 2,293 | 634 | 2,073 | 2,525 | 1,460 | 860 | 2,195 | 2,014 |
| 2016 | 1,116 | 1,559 | 1,076 | 1,097 | 1,192 | 1,671 | 1,533 | 1,710 | 1,771 | 1,267 | 445 | 2,216 |
| 2017 | 1,456 | 808 | 1,107 | 1,518 | 1,175 | 1,551 | 1,442 | 1,737 | 2,610 | 1,194 | 2,275 | 968 |
| 2018 | 1,654 | 1,536 | 1,217 | 1,393 | 1,151 | 1,815 | 1,230 | 1,766 | 1,552 | 1,649 | 2,053 | 1,030 |
| 2019 | 1,200 | 1,287 | 1,553 | 1,939 | 1,611 | 844 | 1,477 | 2,264 | 1,189 | 2,345 | 1,220 | 1,431 |
| 2020 | 1,263 | 1,447 | 1,852 | 1,872 | 1,811 | 741 | 1,098 | 904 | 1,272 | 948 | 1,120 | 1,079 |
| 2021 | 807 | 510 | 758 | 813 | 1,008 | 1,217 | 1,074 | 556 | 697 | 1,719 | 1,137 | 1,453 |
| 2022 | 1,323 | 848 | 645 | 757 | 1,269 | 1,136 | 1,222 | 1,859 | 1,807 | 639 | 1,097 | 782 |
| 2023 | 1,040 | 1,295 | 1,005 | 2,235 | 1,489 | 1,250 | 1,891 | 1,105 | 946 | 1,667 | 1,100 | 1,364 |
| 2024 | 997 | |||||||||||
| - = No Data Reported; -- = Not Applicable; NA = Not Available; W = Withheld to avoid disclosure of individual company data. |
| Release Date: 3/29/2024 |
| Next Release Date: 4/30/2024 |