|
Download Data (XLS File) |
|
||||||||
|
||||||||
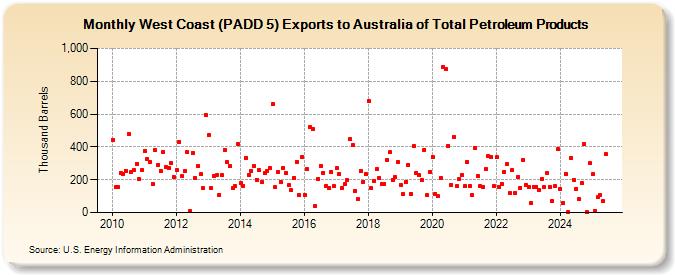
| West Coast (PADD 5) Exports to Australia of Total Petroleum Products (Thousand Barrels) | ||||||||
| Year | Jan | Feb | Mar | Apr | May | Jun | Jul | Aug | Sep | Oct | Nov | Dec |
|---|---|---|---|---|---|---|---|---|---|---|---|---|
| 2010 | 443 | 153 | 155 | 241 | 235 | 254 | 480 | 249 | 259 | 298 | 204 | 260 |
| 2011 | 375 | 327 | 311 | 176 | 379 | 290 | 254 | 368 | 276 | 270 | 299 | 216 |
| 2012 | 259 | 431 | 222 | 254 | 367 | 7 | 364 | 209 | 285 | 232 | 147 | 593 |
| 2013 | 472 | 151 | 222 | 229 | 110 | 226 | 384 | 306 | 281 | 148 | 159 | 419 |
| 2014 | 181 | 163 | 334 | 230 | 255 | 285 | 200 | 258 | 186 | 240 | 251 | 271 |
| 2015 | 661 | 154 | 248 | 189 | 272 | 240 | 167 | 136 | 213 | 311 | 105 | 338 |
| 2016 | 109 | 263 | 519 | 512 | 38 | 203 | 284 | 244 | 161 | 151 | 246 | 160 |
| 2017 | 270 | 235 | 149 | 172 | 198 | 448 | 410 | 134 | 82 | 254 | 189 | 236 |
| 2018 | 677 | 150 | 195 | 265 | 212 | 174 | 174 | 323 | 366 | 200 | 215 | 307 |
| 2019 | 169 | 111 | 189 | 292 | 115 | 404 | 244 | 226 | 199 | 382 | 105 | 249 |
| 2020 | 341 | 116 | 98 | 211 | 887 | 874 | 406 | 170 | 463 | 160 | 206 | 228 |
| 2021 | 160 | 311 | 161 | 104 | 395 | 224 | 159 | 158 | 265 | 342 | 339 | 160 |
| 2022 | 336 | 158 | 177 | 250 | 293 | 120 | 258 | 119 | 219 | 152 | 323 | 169 |
| 2023 | 157 | 59 | 158 | 157 | 137 | 206 | 155 | 238 | 158 | 70 | 159 | 386 |
| 2024 | 146 | |||||||||||
| - = No Data Reported; -- = Not Applicable; NA = Not Available; W = Withheld to avoid disclosure of individual company data. |
| Release Date: 3/29/2024 |
| Next Release Date: 4/30/2024 |