|
Download Data (XLS File) |
|
||||||||
|
||||||||
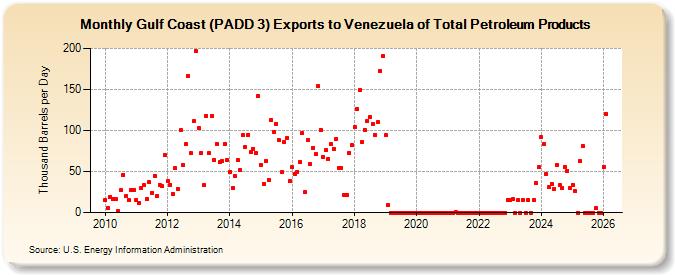
| Gulf Coast (PADD 3) Exports to Venezuela of Total Petroleum Products (Thousand Barrels per Day) | ||||||||
| Year | Jan | Feb | Mar | Apr | May | Jun | Jul | Aug | Sep | Oct | Nov | Dec |
|---|---|---|---|---|---|---|---|---|---|---|---|---|
| 2010 | 15 | 6 | 19 | 16 | 16 | 2 | 27 | 46 | 20 | 15 | 27 | 28 |
| 2011 | 15 | 12 | 30 | 33 | 17 | 37 | 24 | 45 | 20 | 34 | 32 | 70 |
| 2012 | 38 | 34 | 23 | 54 | 29 | 100 | 58 | 83 | 166 | 72 | 111 | 197 |
| 2013 | 103 | 73 | 33 | 118 | 72 | 118 | 64 | 84 | 61 | 63 | 84 | 64 |
| 2014 | 50 | 30 | 45 | 64 | 52 | 94 | 80 | 95 | 74 | 78 | 73 | 142 |
| 2015 | 58 | 35 | 63 | 40 | 113 | 98 | 108 | 88 | 49 | 86 | 91 | 38 |
| 2016 | 55 | 47 | 50 | 61 | 97 | 25 | 88 | 59 | 79 | 71 | 154 | 101 |
| 2017 | 68 | 76 | 65 | 83 | 78 | 90 | 54 | 54 | 22 | 22 | 73 | 82 |
| 2018 | 104 | 126 | 149 | 86 | 101 | 112 | 116 | 108 | 95 | 110 | 172 | 191 |
| 2019 | 94 | 9 | 0 | 0 | 0 | 0 | 0 | 0 | 0 | 0 | 0 | 0 |
| 2020 | 0 | 0 | 0 | 0 | 0 | 0 | 0 | 0 | 0 | 0 | 0 | 0 |
| 2021 | 0 | 0 | 0 | 1 | 0 | 0 | 0 | 0 | 0 | 0 | 0 | 0 |
| 2022 | 0 | 0 | 0 | 0 | 0 | 0 | 0 | 0 | 0 | 0 | 0 | 15 |
| 2023 | 15 | 16 | 0 | 15 | 0 | 15 | 0 | 15 | 0 | 15 | 36 | 55 |
| 2024 | 92 | 83 | 47 | 31 | 35 | 29 | ||||||
| - = No Data Reported; -- = Not Applicable; NA = Not Available; W = Withheld to avoid disclosure of individual company data. |
| Release Date: 8/30/2024 |
| Next Release Date: 9/30/2024 |