|
Download Data (XLS File) |
|
||||||||
|
||||||||
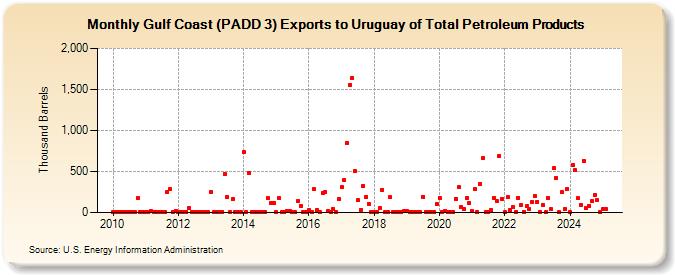
| Gulf Coast (PADD 3) Exports to Uruguay of Total Petroleum Products (Thousand Barrels) | ||||||||
| Year | Jan | Feb | Mar | Apr | May | Jun | Jul | Aug | Sep | Oct | Nov | Dec |
|---|---|---|---|---|---|---|---|---|---|---|---|---|
| 2010 | 1 | 3 | 5 | 3 | 3 | 4 | 6 | 7 | 3 | 180 | 2 | 3 |
| 2011 | 3 | 5 | 18 | 3 | 7 | 8 | 3 | 3 | 252 | 285 | 5 | 16 |
| 2012 | 4 | 3 | 8 | 4 | 55 | 5 | 2 | 6 | 3 | 3 | 1 | 2 |
| 2013 | 255 | 3 | 3 | 7 | 6 | 468 | 192 | 4 | 162 | 3 | 2 | 2 |
| 2014 | 737 | 4 | 482 | 5 | 8 | 3 | 4 | 4 | 5 | 173 | 115 | 118 |
| 2015 | 6 | 177 | 3 | 3 | 17 | 15 | 3 | 3 | 142 | 84 | 1 | 2 |
| 2016 | 28 | 2 | 281 | 30 | 2 | 239 | 250 | 16 | 3 | 41 | 9 | 166 |
| 2017 | 308 | 392 | 852 | 1,555 | 1,640 | 505 | 148 | 31 | 327 | 191 | 106 | 3 |
| 2018 | 3 | 4 | 50 | 279 | 3 | 3 | 185 | 2 | 3 | 2 | 1 | 16 |
| 2019 | 20 | 3 | 2 | 2 | 2 | 2 | 194 | 1 | 1 | 1 | 2 | 107 |
| 2020 | 183 | 2 | 20 | 1 | 2 | 1 | 169 | 310 | 63 | 38 | 180 | 116 |
| 2021 | 20 | 282 | 2 | 348 | 660 | 3 | 1 | 29 | 181 | 142 | 694 | 171 |
| 2022 | 2 | 189 | 27 | 65 | 6 | 181 | 93 | 4 | 75 | 44 | 131 | 198 |
| 2023 | 132 | 2 | 93 | 1 | 182 | 40 | 539 | 418 | 3 | 249 | 40 | 289 |
| 2024 | 1 | 582 | 513 | 174 | ||||||||
| - = No Data Reported; -- = Not Applicable; NA = Not Available; W = Withheld to avoid disclosure of individual company data. |
| Release Date: 6/28/2024 |
| Next Release Date: 7/31/2024 |