|
Download Data (XLS File) |
|
||||||||
|
||||||||
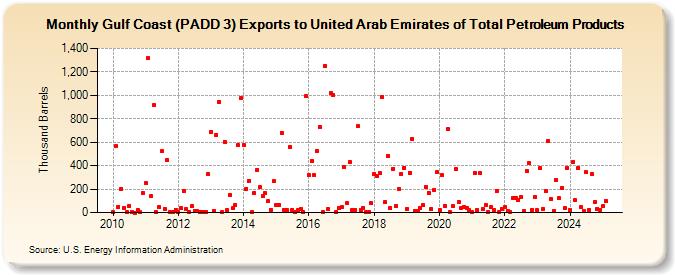
| Gulf Coast (PADD 3) Exports to United Arab Emirates of Total Petroleum Products (Thousand Barrels) | ||||||||
| Year | Jan | Feb | Mar | Apr | May | Jun | Jul | Aug | Sep | Oct | Nov | Dec |
|---|---|---|---|---|---|---|---|---|---|---|---|---|
| 2010 | 1 | 564 | 50 | 204 | 42 | 1 | 54 | 3 | 0 | 23 | 1 | 168 |
| 2011 | 248 | 1,315 | 137 | 914 | 2 | 46 | 522 | 34 | 448 | 3 | 3 | 22 |
| 2012 | 5 | 37 | 183 | 30 | 1 | 53 | 14 | 10 | 3 | 7 | 3 | 325 |
| 2013 | 690 | 17 | 665 | 946 | 1 | 604 | 19 | 151 | 35 | 61 | 575 | 975 |
| 2014 | 572 | 205 | 272 | 2 | 167 | 366 | 214 | 141 | 163 | 96 | 25 | 265 |
| 2015 | 63 | 62 | 679 | 26 | 18 | 561 | 22 | 2 | 19 | 32 | 2 | 991 |
| 2016 | 318 | 442 | 317 | 524 | 730 | 3 | 1,248 | 31 | 1,018 | 1,002 | 5 | 41 |
| 2017 | 44 | 388 | 78 | 430 | 20 | 23 | 734 | 22 | 41 | 2 | 2 | 79 |
| 2018 | 330 | 313 | 339 | 985 | 87 | 482 | 36 | 374 | 55 | 198 | 330 | 383 |
| 2019 | 33 | 340 | 629 | 12 | 15 | 38 | 61 | 221 | 169 | 31 | 193 | 342 |
| 2020 | 19 | 318 | 58 | 711 | 5 | 52 | 373 | 91 | 35 | 48 | 35 | 18 |
| 2021 | 2 | 341 | 18 | 339 | 29 | 61 | 2 | 44 | 22 | 182 | 4 | 31 |
| 2022 | 44 | 15 | 3 | 125 | 127 | 109 | 130 | 13 | 356 | 419 | 24 | 132 |
| 2023 | 18 | 353 | 55 | 159 | 609 | 116 | 17 | 283 | 117 | 228 | 19 | 383 |
| 2024 | 25 | |||||||||||
| - = No Data Reported; -- = Not Applicable; NA = Not Available; W = Withheld to avoid disclosure of individual company data. |
| Release Date: 3/29/2024 |
| Next Release Date: 4/30/2024 |